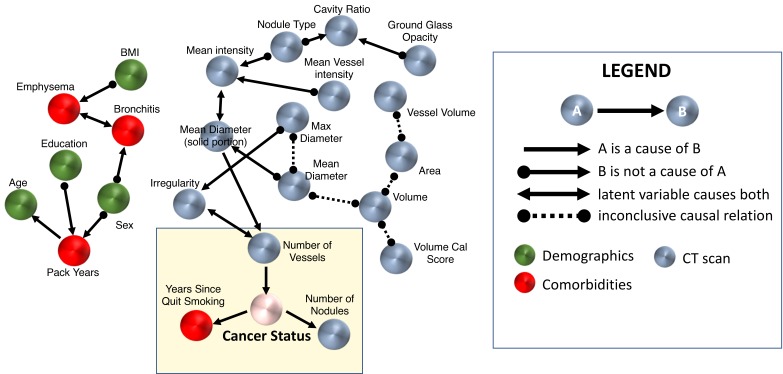
Figure 1.
The causal graph over all data of the training cohort. Nodes in the yellow box correspond to those directly associated with lung cancer status. A list of the variables used for this analysis is provided in online supplementary materials. Note that besides the edges represented by a direct arrow (A→B), all other edges do not exclude the possibility of a latent confounder. BMI, body mass index.

