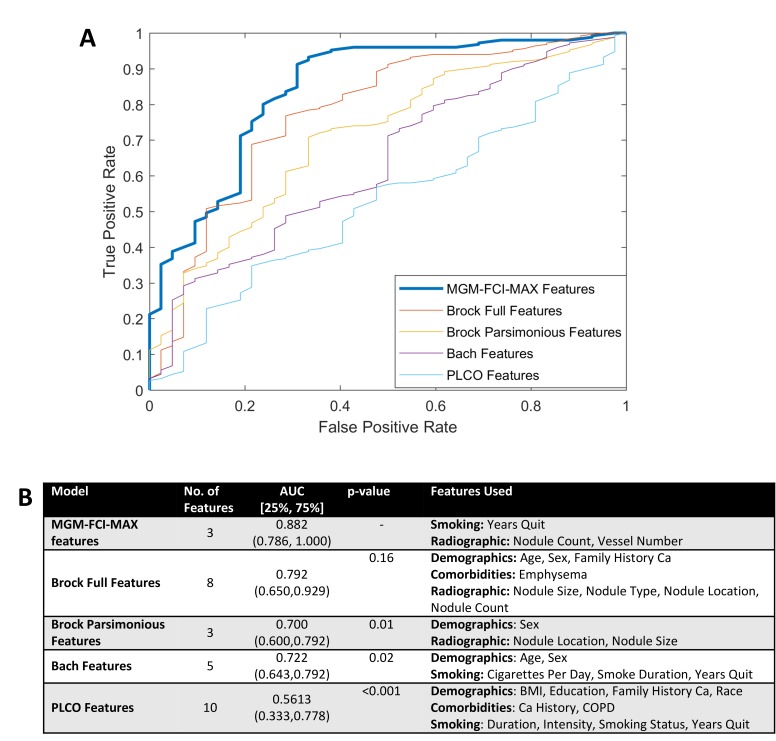
Figure 2.
Comparison of MGM-FCI-MAX-derived with retrained lung cancer prediction models on the training cohort. (A) ROC curves were computed using nested 10-fold cross-validation. (B) Model discrimination measured by AUC. AUC, area under the ROC curve; BMI, body mass index; Ca, cancer; ROC, receiver operating characteristics.

