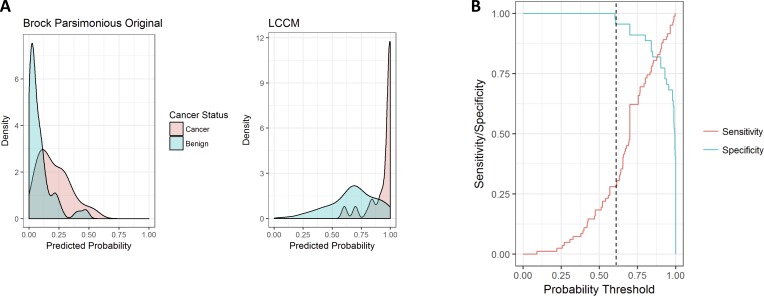
Figure 3.
(A) LCCM sensitivity/specificity plots of predictions across probability thresholds (validation cohort). (B) Distributions of predicted lung cancer score across models (validation cohort) for subjects with cancer (red) and benign nodules (blue). Brock parsimonious original refers to the model with the published coefficients. LCCM, Lung Cancer Causal Model.

