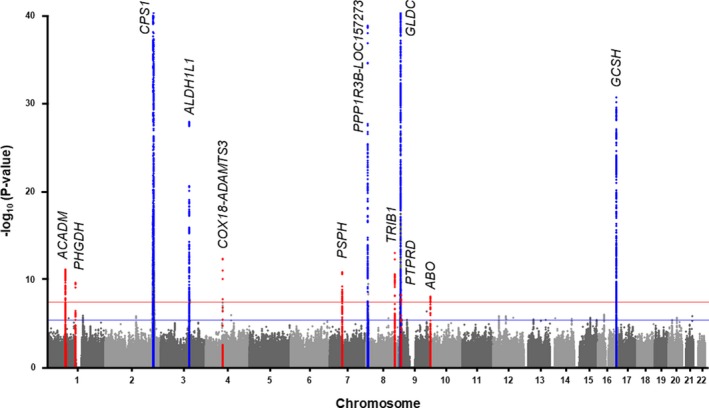
Figure 1.

Results of GWAS meta‐analysis for circulating glycine levels. The Manhattan plot shows 7 novel significantly associated loci for circulating glycine levels (red dots) identified through meta‐analyses of GWAS data from 30 118 subjects in the GeneBank, FR97, FR07, YFS, NFBC66, NFBC86, and METSIM cohorts. The 5 previously known loci are indicated by blue dots and all increased in significance in the meta‐analysis. Genome‐wide thresholds for significant (P=5.0×10⁻⁸) and suggestive (P=5.0×10⁻⁶) association are indicated by the horizontal red and dark blue lines, respectively. P values are truncated at −log10 (P)=40. FR97 and FR07 indicates FINRISK; GWAS, genome‐wide association study; METSIM, METabolic Syndrome In Men Study; NFBC, Northern Finland Birth Cohort; YFS, Cardiovascular Risk in Young Finns.
