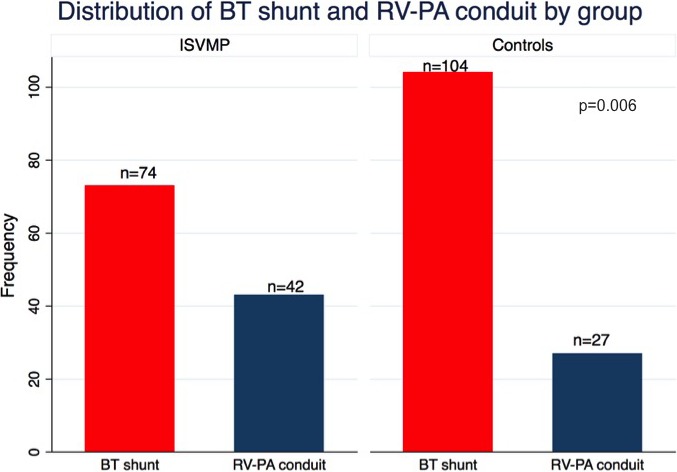
Figure 2.

Distribution of shunt type between groups. Distribution of either BT shunt or RV‐PA shunt between the ISVMP cohort and historical controls. BT indicates Blalock–Taussig shunt; ISVMP, infant single‐ventricle management and monitoring program; RV‐PA, right ventricle to pulmonary artery.
