
Figure 4.
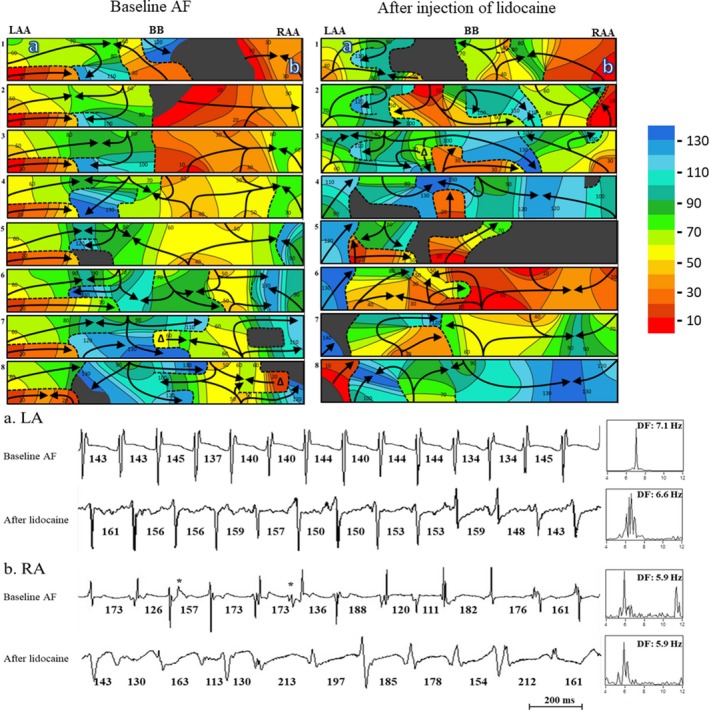
A representative example (patient #6) of an activation sequence map illustrating the disappearance of the LA‐to‐RA frequency gradient after injection of lidocaine. Top panel: Activation sequence maps of 8 consecutive beats during atrial fibrillation (AF) recorded from the LAA, BB, and RAA, with the locations of recording sites a and b. A 10‐ms isochronal color bar is shown on right. The black arrows indicate activation wavefronts. Black areas indicate nonactivation. Dashed lines indicate a functional line of block. T‐bars ( ) indicate block attributed to effective refractory period (ERP). Bottom panel: Bipolar AEGs from selected sites a (LA) and b (RA) with dominant frequency (DF) during baseline AF and after injection of lidocaine. The power spectrum is shown to the right of the traces with the dominant frequency. See text for Discussion. AF, atrial fibrillation; BB indicates Bachmann's bundle; DF, dominant frequency; ERP, effective refractory period; LAA, left atrial appendage; RAA, right atrial appendage.