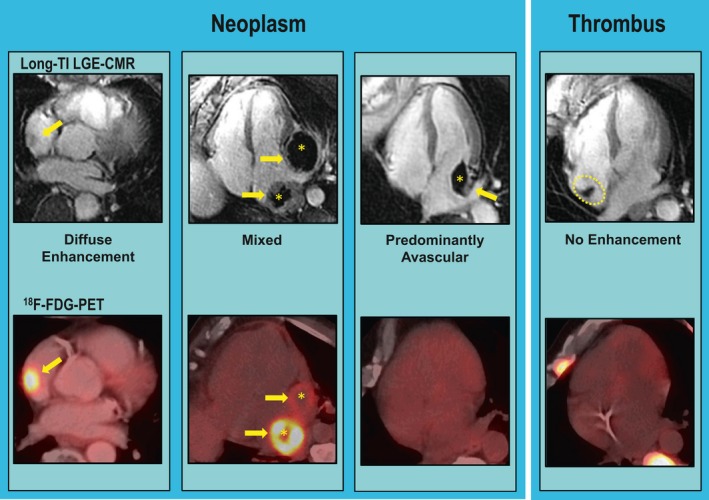
Figure 2.

Representative examples of neoplasm and thrombus as established by long inversion time (long‐TI) late gadolinium enhancement cardiac magnetic resonance (LGE‐CMR) tissue characterization, including neoplasm subtypes comprising diffuse enhancement (left), mixed (prominent enhancing and avascular components; center), and predominantly avascular enhancement (right; arrows indicate contrast‐enhancing regions, asterisks indicate avascular regions). Corresponding 18F‐fluorodeoxyglucose (18F‐FDG)–positron emission tomography (PET) images shown on bottom row: Note prominent FDG avidity corresponding to regions of contrast enhancement, and lack of FDG avidity in both predominantly avascular neoplasm as well as thrombus (far right).
