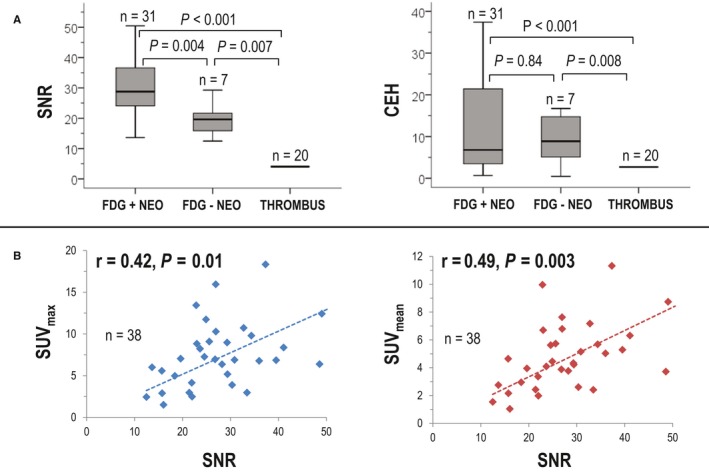
Figure 5.

Quantitative contrast enhancement in relation to positron emission tomography–evidenced metabolic activity. A, Signal‐to‐noise ratio (SNR; left) and contrast‐enhancement heterogeneity (CEH; right) among cardiac mass subgroups partitioned based on diagnostic test interpretation. Note higher SNR for fluorodeoxyglucose (FDG) avid vs nonavid neoplasm (NEO; P=0.004), paralleling higher SNR and CEH for both NEO subtypes vs thrombus (THR; both P<0.001). Data shown as median plus or minus interquartile range. B, Scatter plots demonstrating correlation between SNR and standardized uptake value (SUV) within NEO. Highly mobile lesions excluded from analyses (due to imprecise colocalization). Note significant correlations between magnitude of contrast‐enhancement and FDG avidity (P<0.05).
