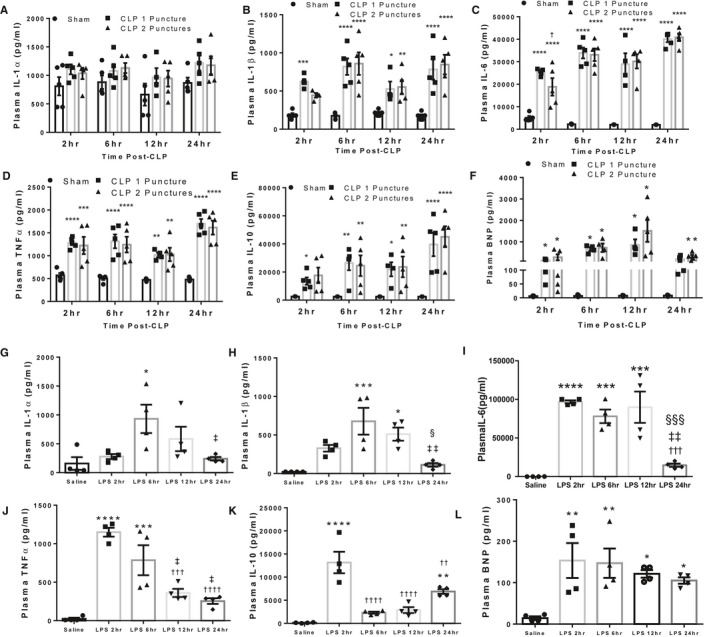
Figure 1.

LPS injection and CLP surgery result in rapid release of inflammatory cytokines. A through F, Plasma IL‐1α (A), IL‐1β (B), IL‐6 (C), TNF‐α (D), IL‐10 (E), and B‐type natriuretic peptide (F) levels following sham, CLP 1 puncture, and CLP 2 puncture surgery at 2, 6, 12, and 24 hours after induction. Each timepoint represents a separate cohort of mice. *P<0.05, **P<0.01, ***P<0.001, ****P<0.0001 vs Sham, † P<0.5 vs CLP1P by 1‐way ANOVA with Tukey multiple comparisons. n=5 sham, n=5 CLP1P, n=5 CLP2P per timepoint. G‐L: Plasma IL‐1α (G), IL‐1β (H), ΙL‐6 (I), TNF‐α (J), IL‐10 (K), and B‐type natriuretic peptide (L) at 2, 6, 12, and 24 hours post‐LPS injection. Saline mice were injected with equal volume saline collected 6 hours after injection. *P<0.05, **P<0.01, ***P<0.001, ****P<0.0001 vs Saline, † P<0.05, †† P<0.01, ††† P<0.001, †††† P<0.0001 vs LPS 2 hours, ‡ P<0.05, ‡‡ P<0.01 vs LPS 6 hours, § P<0.05, §§§ P<0.001 vs 24 hours by 1‐way ANOVA with Tukey multiple comparisons, n=4 saline, n=4 LPS 2 hours, n=4 LPS 6 hours, n=4 LPS 12 hours, n=4 LPS 24 hours. BNP indicates B‐type natriuretic peptide; CLP, cecal ligation and puncture; IL, interleukin; LPS lipopolysaccharide; TNF tumor necrosis factor.
