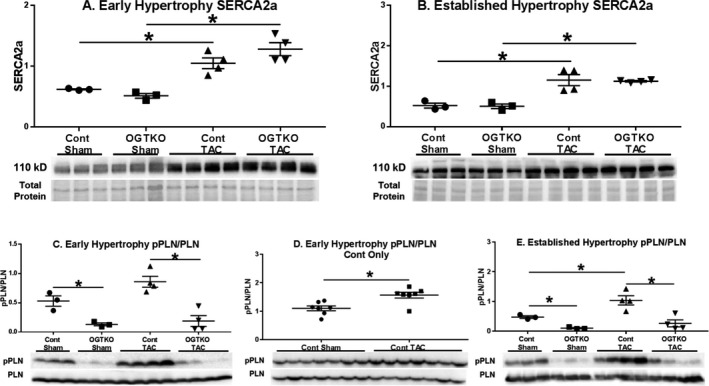
Figure 7.

Sarco/endoplasmic reticulum Ca2+‐ATPase 2a (SERCA2a) protein levels and phospholamban phosphorylation (pPLN) in early and established hypertrophy. Immunoblots from early and established hypertrophy for total SERCA2a protein levels (A, B) and phosphorylated phospholamban Ser16 to total phospholamban (PLN) (C through E). For (A through E) n=3 control sham, n=3 O‐linked β‐N‐acetylglucosamine transferase knockout (OGTKO) sham, n=4 control transverse aortic constriction (TAC), n=4 OGTKO TAC. For (D) n=7 control sham, n=7 control TAC. Values are arbitrary units reported as mean±standard error of the mean. *P<0.05 between groups indicated with the bar. For (C) control sham vs OGTKO sham, P value from t test=0.013 and P value from Tukey procedure=0.0522. For (E) control sham vs OGTKO sham, P value from t test=0.0014 and P value from Tukey procedure=0.22.
