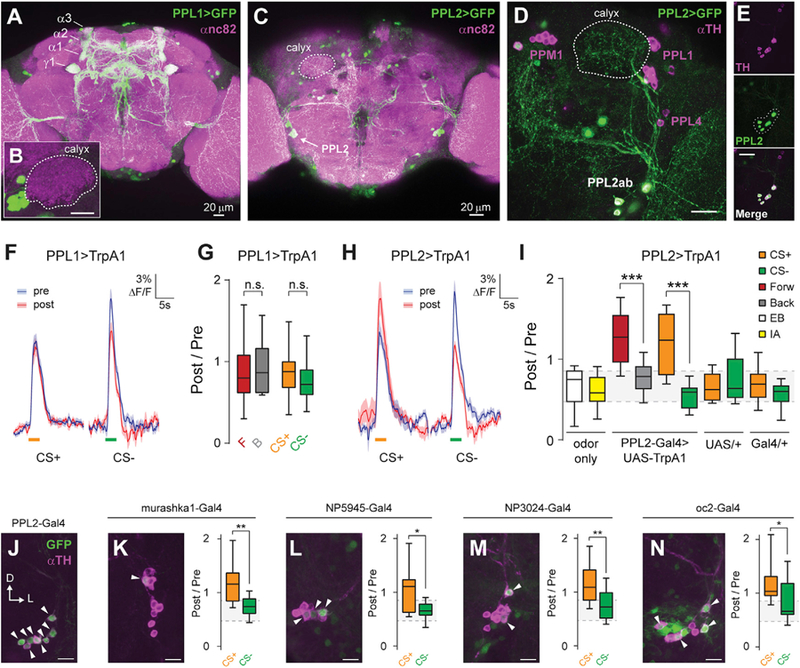
Figure 2. Dopaminergic Plasticity Maps to PPL2 Neurons, Rather Than PPL1.

(A) Maximum intensity projection of anti-GFP (green) and anti-nc82 (magenta) immunostaining of the brain of a PPL1-Gal4 > UAS-GFP fly.
(B) Inset showing lack of innervation of the calyx. Scale bar, 20 mm.
(C) Maximum intensity projection of anti-GFP (green) and anti-nc82 (magenta) immunostaining of the posterior brain of a PPL2-Gal4 > UAS-GFP fly.
(D) Maximum intensity projection of anti-GFP (green) and anti-TH (magenta) immunostaining of a PPL2-Gal4 > UAS-GFP fly, showing terminal projections of PPL2ab neurons in the MB calyx (outlined with a dotted white line). Scale bar, 20 μm.
(E) PPL2-Gal4 driver labeling all TH-immunopositive neurons in the PPL2 cluster, as shown by complete overlap between GFP and TH staining in the PPL2 cell bodies (dotted outline in GFP image). Scale bar, 20 μm.
(F) Odor responses (mean ± SEM) in PPL1-Gal4 > UAS-TrpA1; MB-GCaMP3 flies. EB was presented as CS+. IA was presented as CS—. Shaded bars represent odor delivery duration.
(G) Post-/pre-odor response ratio in the g lobe when activation of PPL1 neurons was paired with odor exposure (p > 0.05, Dunn’s post hoc comparisons; n = 12–18).
(H) Odor responses (mean ± SEM) in PPL2-Gal4 > UAS-TrpA1; MB-GCaMP3 flies. EB was presented as CS+. IA was presented as CS—. Shaded bars represent odor delivery duration.
(I) Post-/pre-odor response ratio in the g lobe when activation of PPL2 neurons was paired with odor exposure (n ≥ 12). There was a significant effect across groups (p < 0.01, Kruskal-Wallis). Post hoc comparisons were performed between forward and backward protocols and between CS+ and CS− responses for the labeled genotypes. The gray shading indicates the inter-quartile range of the odor-only controls (***p < 0.001, Dunn).
(J) Maximum intensity projection of anti-GFP (green) and anti-TH (magenta) immunostaining of the PPL2 somata from a PPL2-Gal4 > UAS-GFP fly. Arrowheads indicate cells positive for both TH and GFP. Scale bar, 10 μm.
(K–N) Immunostaining of additional PPL2-Gal4 drivers (K: murashka1-Gal4; L: NP5945-Gal4; M: NP3024-Gal4; N: oc2-Gal4) (left), and effect of pairing stimulation of PPL2 neurons with odor exposure in a conditioning paradigm (right), as in (I). n ≥ 12 for each genotype and condition. Scale bars, 10 mm (*p < 0.05, **p < 0.01, Mann-Whitney).
