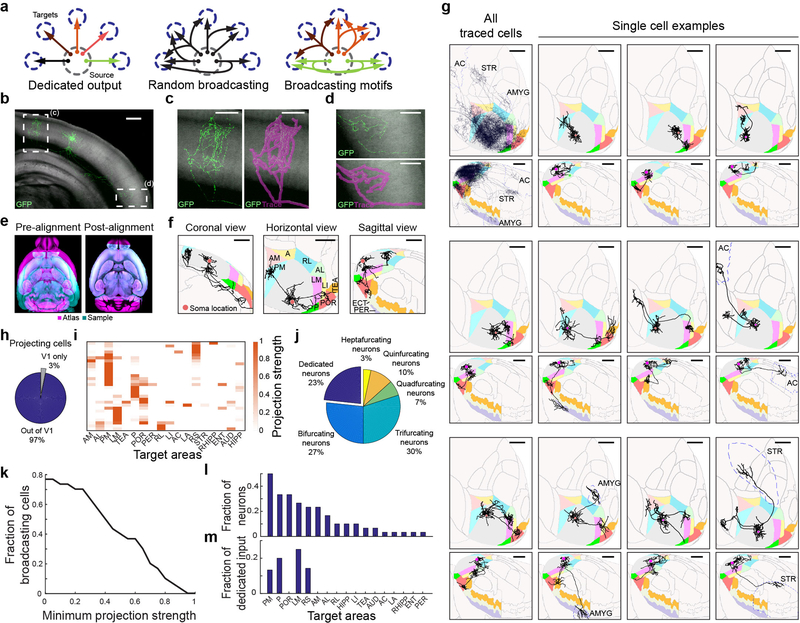
Figure 1: Brain-wide single-cell tracing reveals the diversity of axonal projection patterns of layer 2/3 V1 neurons, with most cells projecting to more than one target area.
(a) Three hypothetical modes of inter-areal information transfer from one area to its multiple targets. Neurons (arrows) could each project to a single area (top) or to several areas either randomly (middle) or in predefined projection patterns (bottom). (b) Maximum projection of a representative example GFP-filled neuron coronal view acquired by serial-section 2-photon microscopy. Auto-fluorescence from the red channel is used to show the brain’s ultrastructure (gray background). Scale bar = 600 μm. N = 71. (c-d) Higher magnification of the medial (c) and lateral (d) axonal arbor of the example cell. Scale bar = 300 μm. (e) Horizontal section through a sample brain (cyan) and Allen reference atlas (ARA; magenta) before (left) and after (right) rigid and non-rigid transformation of the brain to the atlas. (f) Coronal, sagittal and horizontal projections of the traced example cell overlaid in ARA space. Target cortical areas are coloured as indicated. Areas: A, anterior; AL: anterolateral; AM: anteromedial; LI: lateroitermediate; LM: lateral; P: posterior; PM: posteromedial; POR: postrhinal; RL: rostrolateral; TEA: temporal association; ECT: ectorhinal; PER: perirhinal. Scale bar = 1 mm. (g) Overlay of all traced single neurons (top left) and 11 example cells in Allen Reference Atlas (ARA) space; horizontal view (upper panel) and sagittal view (lower panel). Dashed outlines label non-visual target areas: AC: anterior cingulate cortex; STR, striatum; AMYG: amygdala. Note that these images are for illustration purposes only because a 2D projection cannot faithfully capture the true axonal arborisation pattern in 3D. Scale bar = 1 mm. (h) Pie chart illustrating the fraction of traced single neurons that project to at least one target area outside V1, where at least 1 mm of axonal innervation is required for an area to be considered a target. (i) Projection pattern of all GFP-filled V1 neurons targeted randomly (upper panel, n=31). The colour-code reflects the projection strengths of each neuron, determined as axon length per target area, normalized to the axon length in the target area receiving the densest innervation. Only brain areas that receive input form at least one neuron, as well as striatum, are shown. Areas: AUD: auditory cortex; ENT: entorhinal; HIPP: hippocampus; LA: lateral amygdala; RHIPP: retrohippocampal region; RS: retrosplenial. (j) The number of projection targets for every neuron that projects out of V1. (k) The proportion of cells targeting more than one area, when projection targets that receive projections weaker than the indicated projection strength are ignored. For each neuron, projection strengths are normalized to axon length in the target area receiving the densest innervation. (l) The fraction of neurons projecting to each of the 18 target areas of V1. (m) The fraction of neurons innervating a single target area (‘dedicated’ projection neurons) out of all neurons that innervate that area.

