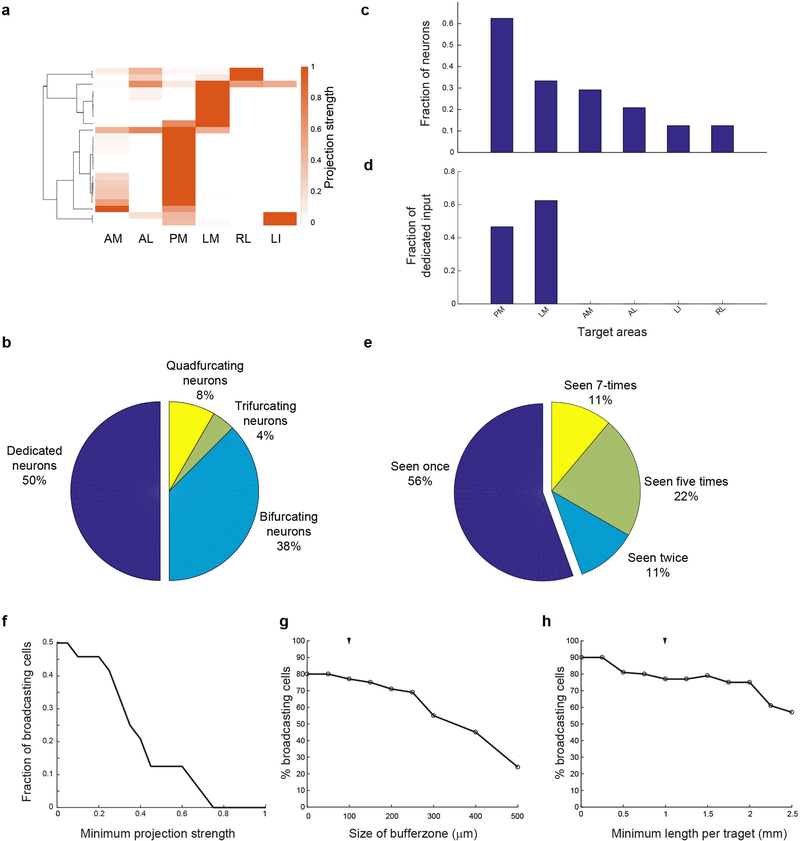
Extended Data Figure 7: Conclusions from fluorescence-based single neuron tracing data hold true if analysis is restricted to subset of target areas.
(a) The projection patterns of re-constructed GFP-filled neurons when only the six target areas LI, LM, AL, PM, AM, and RL are considered. Projection strengths are normalized to the maximum projection of each neuron, and only neurons projecting to at least one target area are shown. (b) Pie chart showing the distribu-tion of target area numbers per projecting neuron. (c) Bar graph illustrating the fraction of all cells projecting to each target area. (d) The fraction dedicated input per area. (e) The number of times each binarized projection motif is observed. (f) The fraction of broadcasting cells as a function of the minimum projection strength (relative to the primary target) that each area needs to receive to be considered a target. (g) The fraction of broadcasting cells as a function of increasing buffer zones between areas within which axons are ignored, assuming a minimum projection of 1 mm of axon per target area. (h) The fraction of broadcasting cells as a function of the minimal amount of axon per area for it to be considered a target, assuming buffer zones of 100 μm width.

