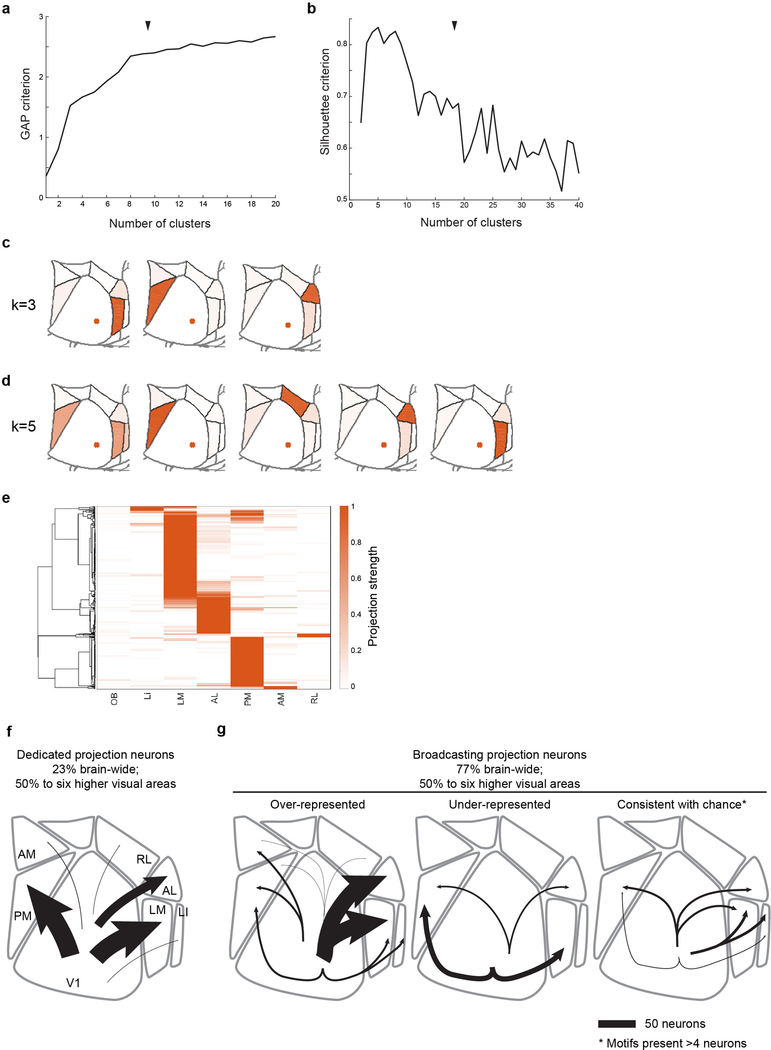
Extended Data Figure 10: Clustering of MAPseq data and data summary.
(a) GAP and (b) Silhouette criteria for k-means clustering of the MAPseq neurons as a function of the number of clusters. Black arrow heads indicate chosen number of clusters (k=8). (c,d) Centroids for alterna-tive, near-optimal cluster number choices with (c) k=3 and (d) k=5. (e) Hierarchical clustering results of the MAPseq dataset using a cosine distance metric. Color intensity in (c,d,e) indicated projection strengths. (f,g) Summary of single-neurons projections from V1. (f) Cells targeting single higher visual areas (dedicated projection neurons) comprise the minority of layer 2/3 V1 projection neurons. Among the areas analysed by MAPseq, dedicated projection neurons pre-dominantly innervate cortical areas LM or PM. (g) Cells projecting to two or more areas (broad-casting projection neurons) are the dominant mode of information transfer from V1 to higher visual areas. In the six areas analysed by MAPseq, broadcasting neurons innervate combinations of target areas in a non-random manner, including those that are more or less abundant than ex-pected by chance. Line width indicates the absolute abundance of each projection type as ob-served in the MAPseq dataset.

