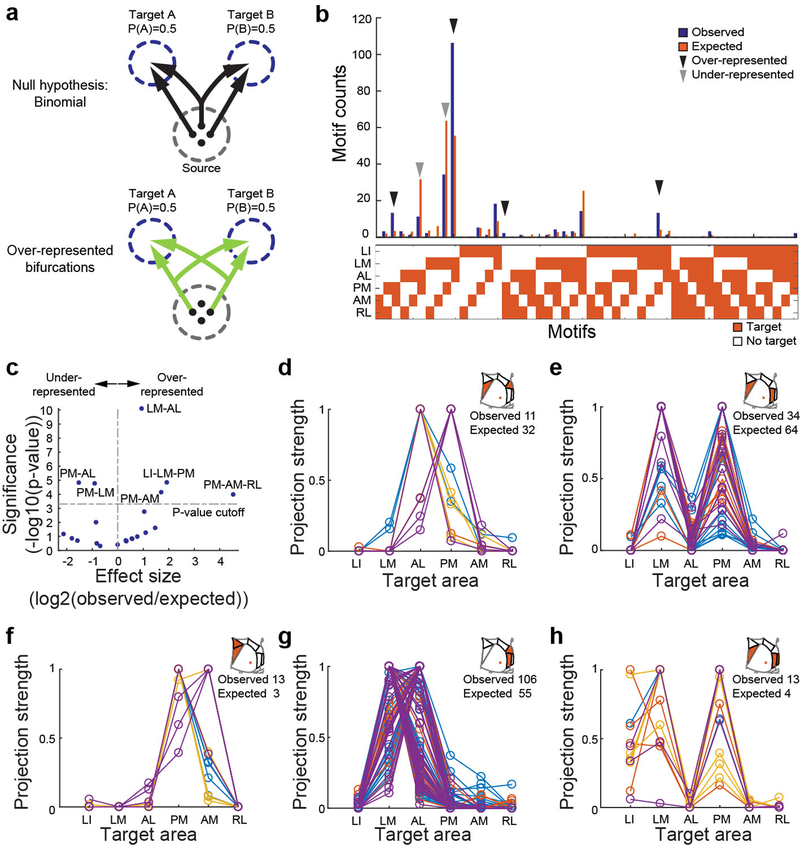
Figure 3: Over- and under-represented projection motifs of neurons in primary visual cortex.
(a) The null hypothesis of independent projections to two target areas (left) and an example deviation (over-represented bifurcation) from the null hypothesis (right). (b) The observed and expected abundance of all possible bi-, tri- and quadfrucation motifs in the MAPseq dataset. Significantly over- or under-represented motifs, based on a binomial test with Bonferoni correction (see Methods), are indicated by black and grey arrowheads, respectively. N=553 neurons from 4 animals. (c) Statistical significance of over- and under-represented broadcasting motifs and associated effect sizes, based on a binomial test with Bonferoni correction (see Methods). N=553 neurons from 4 animals. (d-h) The projection strengths of the individual neurons (one per line) giving rise to the six under-represented (d,e) or over-represented (f-h) projection motifs. For each neuron, the projections strength in each target area is normalized to the neuron’s maximum projection strength. Lines of the same color represent neurons mapped in the same brain (n=4 mice).

