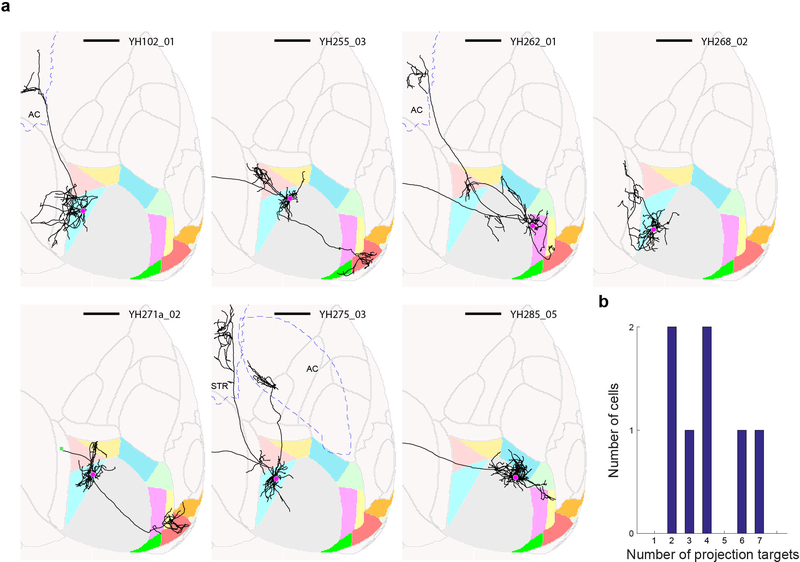
Extended Data Figure 5: Individual neurons in higher visual areas project to more than one target area.
(a) Thumbnails of all traced neurons with cell bodies not in V1. Brain area identity is color-coded as in Figure 1. Cell identity is indicated at the top right of each thumbnail. Scale bar = 1 mm. (b) Histogram of the number of target areas per cell.

