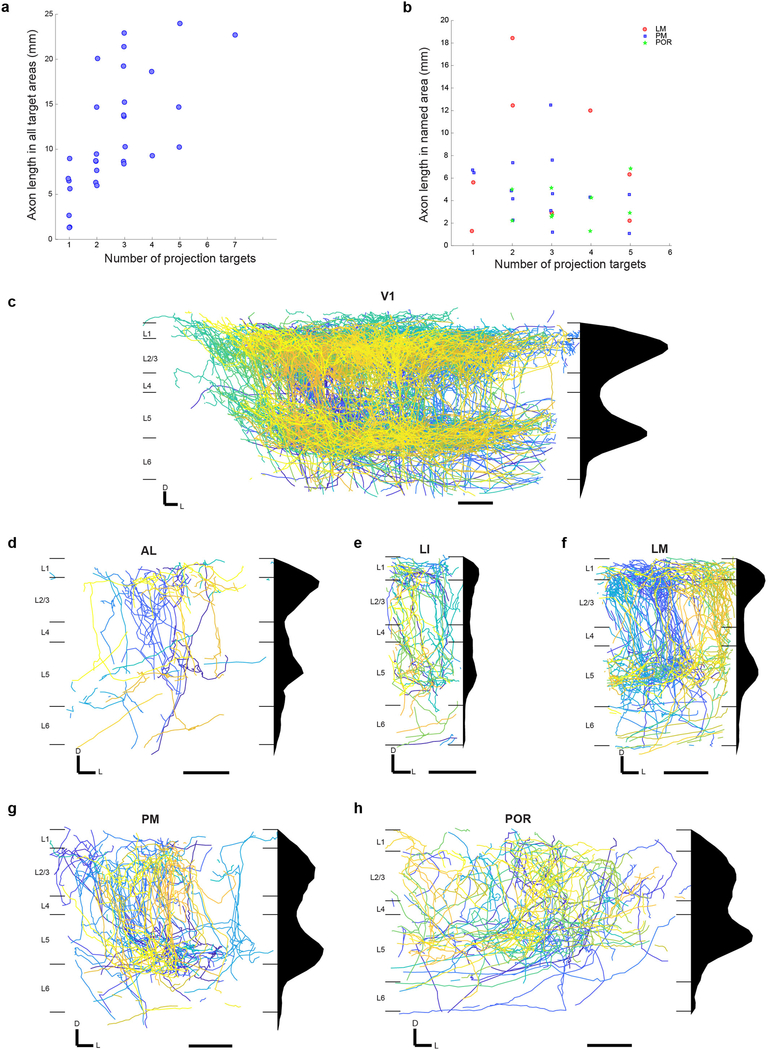
Extended Data Figure 6: Density of axonal innervation by area and layer of V1 layer 2/3 projection neurons.
(a) Total axon length plotted as a function of the number of targets inner-vated by every V1 projection neuron. (b) Axon length in area LM, PM or POR plotted as a func-tion of the total number of targets innervated by each neuron projecting to the respective area. (c–h) The axons of V1 neurons in target areas most densely innervate layers 2/3 and 5, with some density in layer 1, but less in layers 4 and 6, often recapitulating the laminar axonal profile within V1. Coronal views of each area are shown in ARA space (left) and axonal arbors of each neuron innervating the area are color coded. Scale bar = 200 m. A histogram of the laminar innervation is shown (right). Note that cells with abrupt terminations outside the shown area were included in this analysis. Areas depicted are (c) V1, (d) AL, (e) LI, (f) LM, (g) PM, (h) POR. White matter axons are not shown.

