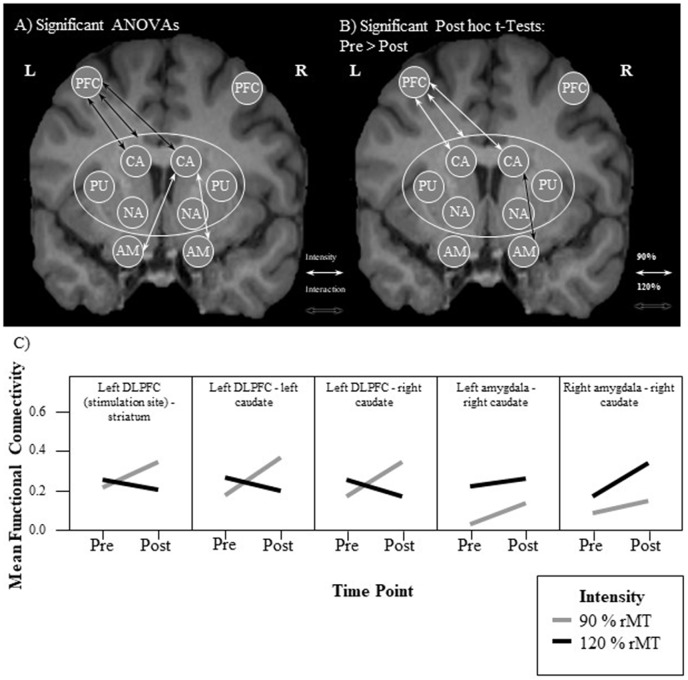
Figure 2.
Visualization of results. (A,B) Each arrow represents a significant test result. Significant analysis of variance (ANOVA) effects are shown in (A) and significant paired t-tests in (B). It can be seen that functional connectivity between the left prefrontal cortex (PFC; stimulation site) and the left and right caudate, respectively, as well as between the right caudate and the left and right amygdala, respectively, was modulated by the experimental stimulation. (A) White arrows indicate a significant intensity effect and black arrows a significant interaction effect. White ellipses indicate a seed region of interest. (B) Only pre-post transcranial magnetic stimulation (TMS) comparisons were calculated. All significant changes were increases from pre to post. Functional connectivity increased significantly only in the 90% condition between the stimulation site and the striatum. Analyzing the functional connectivity patterns between the stimulation site and each of the subregions of the striatum revealed that only the increase in functional connectivity between the stimulation site and the right and left caudate, respectively was significant. Additionally, functional connectivity between the right amygdala and the right caudate was increased only in the 120% condition. (C) Mean functional connectivity results. Shown are mean Fisher-Z-transformed correlations for the significant ANOVAs of functional connectivity between seeds, in the four different conditions 90% pre and post (gray line) and 120% pre and post (black line) measurements. Positive values indicate a positive coupling of signals between the two seeds. The first graph visualizes results between the stimulation site (left DLFC) and the entire striatum [consisting of left and right caudate (CA), left and right nucleus accumbens (NA), as well as left and right putamen (PU)]. AM, amygdala.

