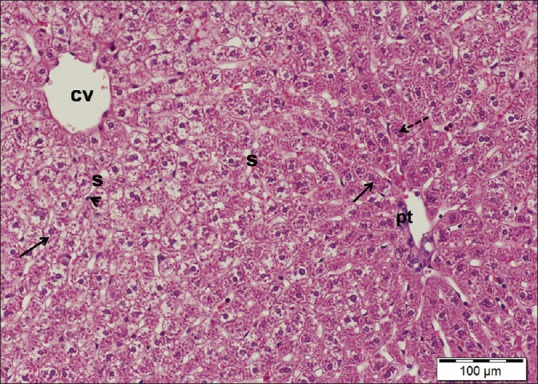
Figure 1.

A liver section of control rat showing hepatocytes (arrows) with a granular cytoplasm and vesicular nuclei and the central vein (cv). Note a portal tract (pt) and blood sinusoids (s) lining with Kupffer cells (arrowhead). Dotted arrow points to binucleated hepatocyte. H and E stain, scale bar 100 μm
