
Figure 2.
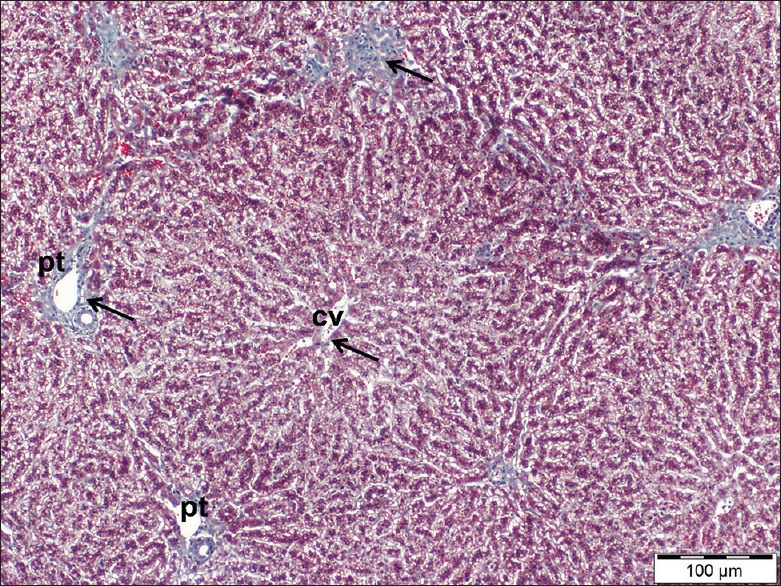
A liver section of control rat showing few fine collagen fibers (arrows) around a central vein (cv) as well as portal tracts (pt). Masson's trichrome, scale bar 100 μm
Official websites use .gov
A
.gov website belongs to an official
government organization in the United States.
Secure .gov websites use HTTPS
A lock (
) or https:// means you've safely
connected to the .gov website. Share sensitive
information only on official, secure websites.
A liver section of control rat showing few fine collagen fibers (arrows) around a central vein (cv) as well as portal tracts (pt). Masson's trichrome, scale bar 100 μm