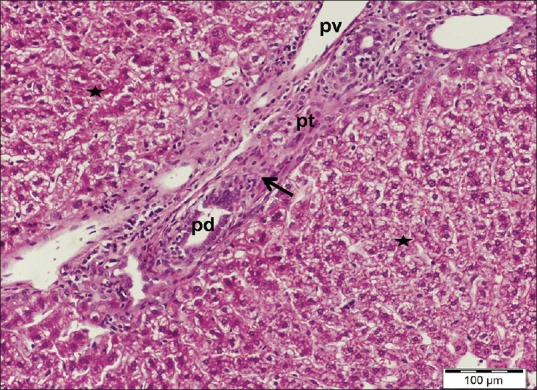
Figure 5.

A liver section of cisplatin-treated group showing enlargement of a portal tract (pt) with dilated portal vein (pv) and proliferating bile ductules (pd) as well as periportal mononuclear cellular infiltrations (arrow). Note the loss of cellular cords arrangement with area of hepatocytes dissolutions (stars). H and E stain, scale bar 100 μm
