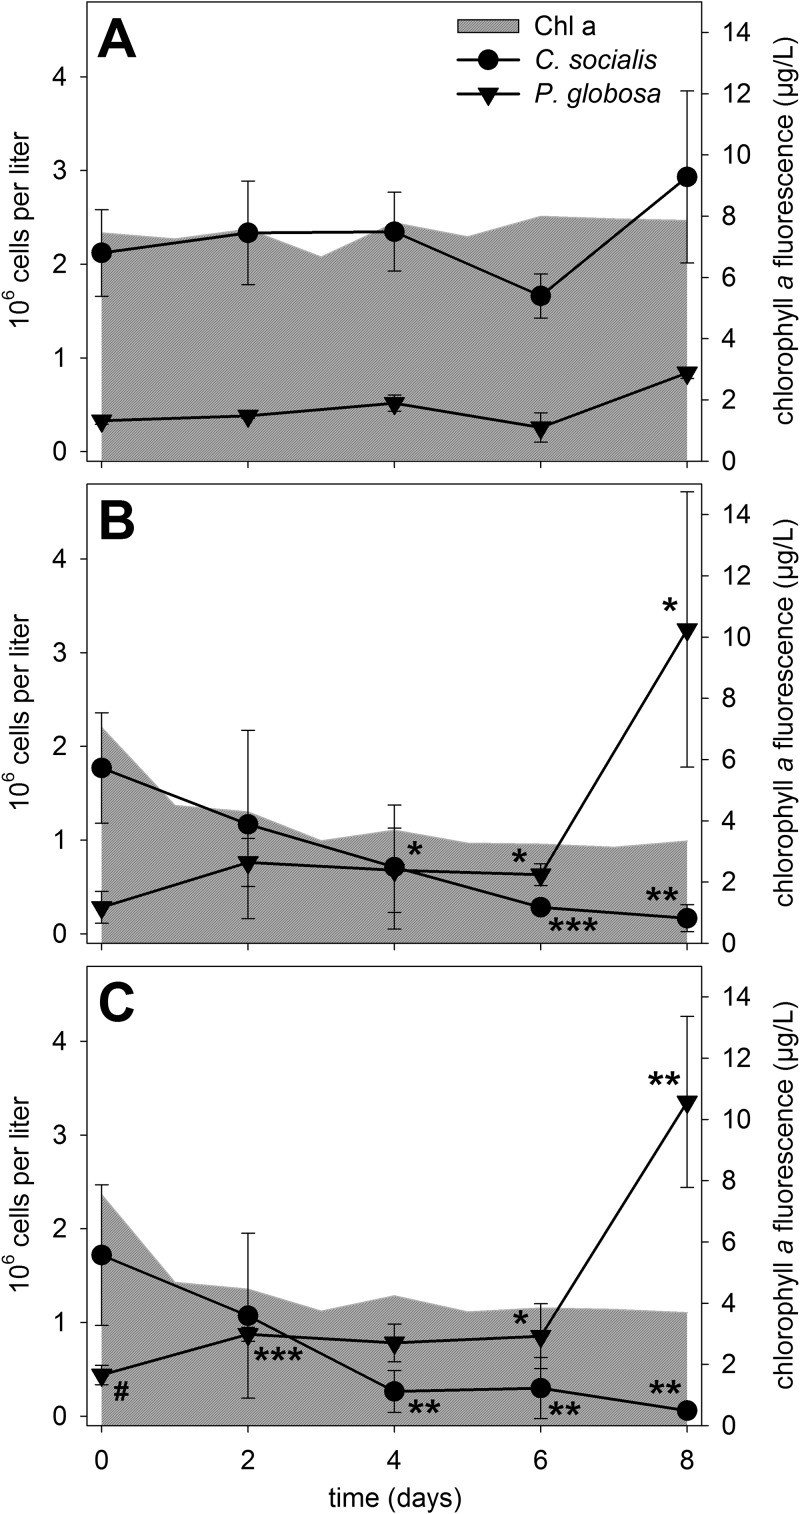
FIG 2.
Phytoplankton development after bacterial infection. Chaetoceros socialis and Phaeocystis sp. cell counts (means ± standard deviations [SDs] of three biological replicates) and total chlorophyll a (Chl a) fluorescence (means of three biological replicates) are depicted for the control (A), the low infection scenario (B), and the high infection scenario (C). Significant differences in cell counts were tested via unpaired two-sided t tests, compared to the control treatment, for each time point and are indicated by asterisks (*, P < 0.05; **, P < 0.01; ***, P < 0.001) (see Table S4 in the supplemental material). The number sign marks a data point without normal distribution. Further statistical analyses of cell counts and chlorophyll a levels for the comparison between treatments (B and C) and for assessment of control stability (A) are given in Tables S1 to S4.

