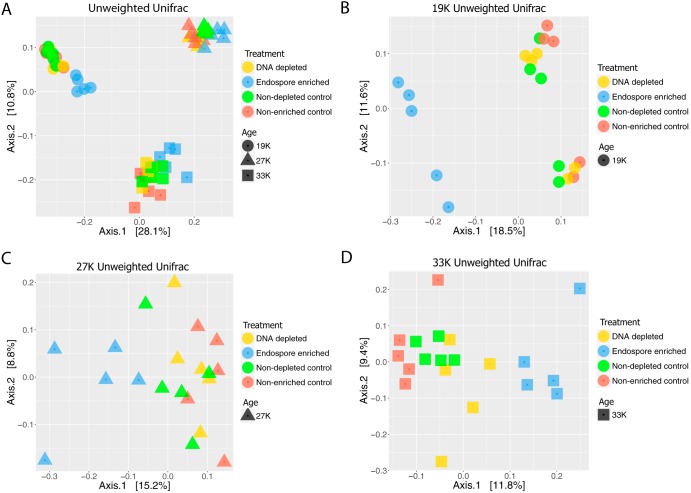
FIG 5.
PCoA based on weighted UniFrac distances. (A) PCoA plots of all ages and treatments. (B to D) PCoA plots by age. Depleted, samples that underwent depletion of dead DNA; nondepleted controls, samples that were extracted together but did not receive the propidium monoazide treatment; endospore enriched, samples that underwent endospore enrichment; nonenriched controls, samples that were extracted in parallel but did not undergo treatment. Samples differed significantly by age (PERMANOVA; R2 = 0.83, F = 135.64, P < 0.001) (A) and treatment for the youngest (PERMANOVA; R2 = 0.51, F = 5.65, P < 0.001) (B), the intermediate (PERMANOVA; R2 = 0.42, F = 3.87, P < 0.01) (C), and the oldest (PERMANOVA; R2 = 0.37, F = 3.14, P < 0.01) (D) samples.

