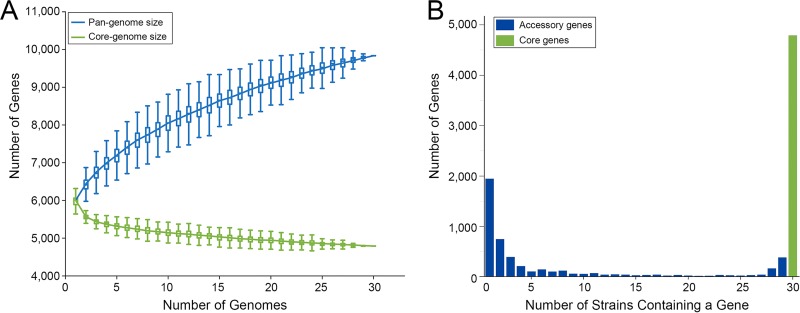
FIG 1.
The pan-genome, core genome, and accessory genome profiles of S. albidoflavus. (A) The sizes of core and pan-genomes in relation to numbers of genomes added into the gene pool. Box plots show the 25th and 75th percentiles, with medians shown as horizontal lines, and whiskers indicate the lowest and highest values within 1.5 times the interquartile range (IQR) from the first and third quartiles, respectively. The curve for the pan-genome is fitted by the power-law regression model (ypan = Apan xBpan + Cpan), with r2 = 0.999, Apan = 1488.57 ± 1.67, Bpan = 0.37, and Cpan = 4,502.37 ± 4.34. Bpan is equivalent to the parameter γ, and α (= 1 − γ) < 1 indicates that the pan-genome does not approach a constant as more genomes are sampled. The curve for the core genome is fitted by the exponential curve fit model (ycore = Acore eBcore.x + Ccore), with r2 = 0.938, Acore = 1,060.74 ± 21.92, Bcore = −0.13, and Ccore = 4,838.38 ± 5.57. (B) Distribution of genes across strains.

