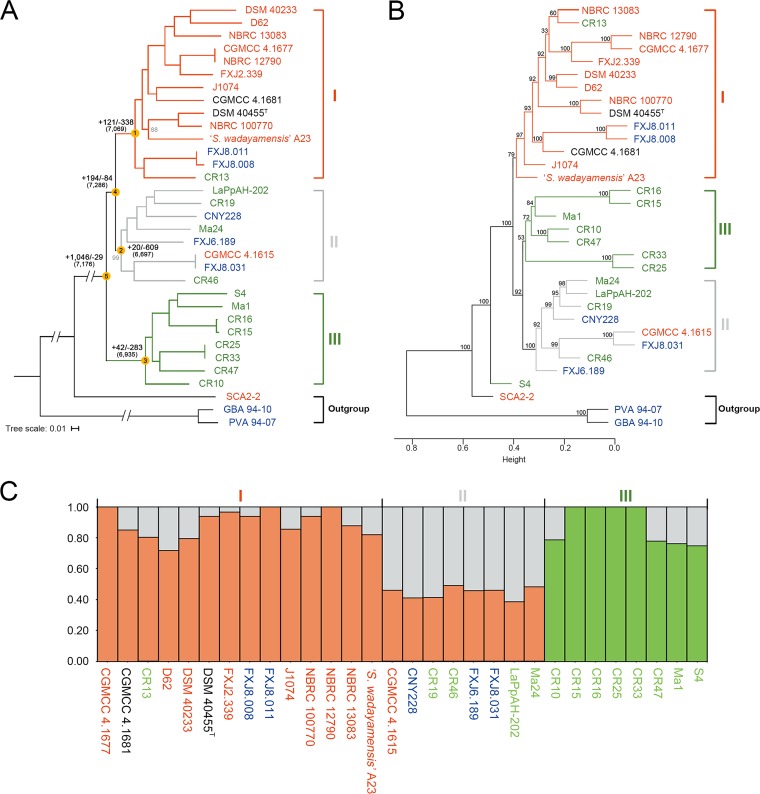
FIG 2.
Phylogeny and population structure of S. albidoflavus. Strains collected from different habitats are represented in different colors (red, soil or plants; green, insects; blue, sea; black, uncertain). “I,” “II,” or “III” indicates genetic clusters or clades. (A) Maximum-likelihood phylogeny generated from concatenated 4,116 single-copy core genes of the 33 strains, including the three outgroup strains. Bootstrap values less than 100% are shown in gray at the nodes. The scale bar indicates 1% sequence divergence. Ancestral genome contents of S. albidoflavus were reconstructed using COUNT (81). The numbers of gene gain (+) and loss (−) events are indicated next to the deep nodes, and the total numbers of ancestral orthologous genes present at each of the nodes are shown in parentheses. (B) Hierarchical cluster analysis based on the presence or absence of dispensable genes in the 33 strains. Numbers above branches are bootstrap support values from 1,000 replicates. Height indicates the dissimilarity between genomes. (C) Structure plot based on concatenated 4,663 single-copy core genes of the 30 S. albidoflavus strains, showing the contribution to each S. albidoflavus strain from each of the three hypothetical ancestral populations.

