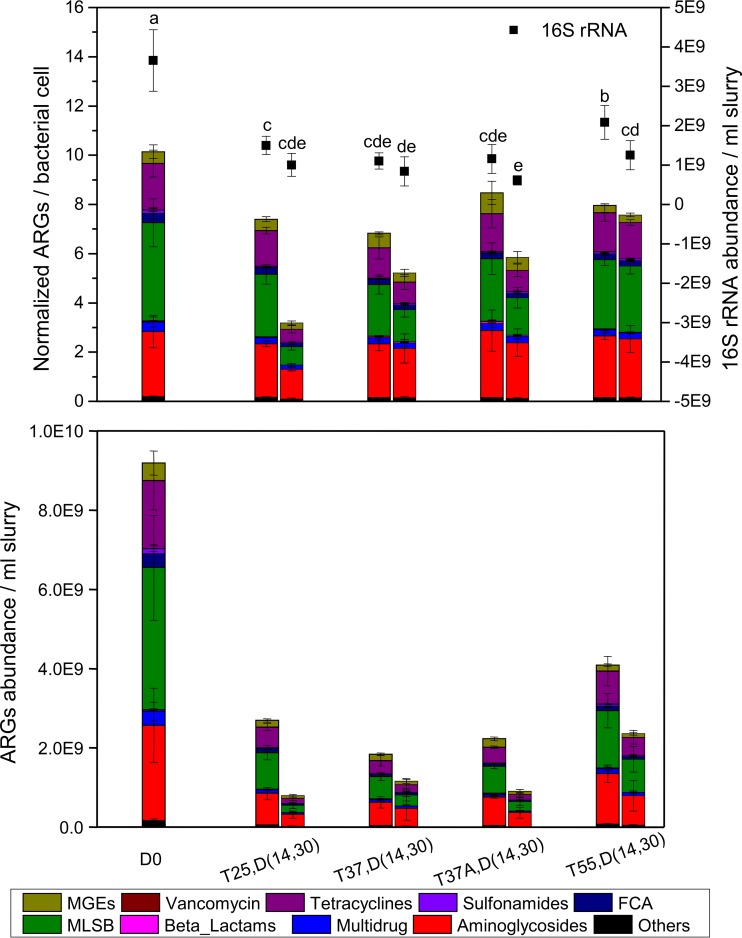
FIG 1.
Abundance of ARGs, MGEs, and 16S rRNA genes detected in manure slurry on days 0, 14, and 30. (Top) Left y axis indicates the relative copy numbers of MGEs and ARGs normalized to bacterial cell; right y axis indicates 16S rRNA gene abundance. (Bottom) The absolute copy numbers of MGEs and ARGs. In sample name, the letters “D,” “T,” and “A” indicate day, temperature, and antibiotics, respectively. The lowercase letters were used to indicate the differences among 16S rRNA data revealed by one-way analysis of variance (ANOVA) after multiple comparison.

