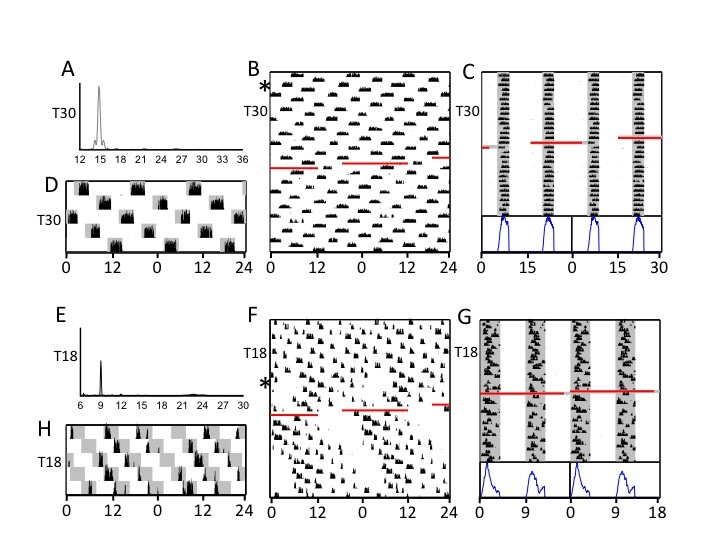
Figure 3.

Representative activity data from individual hamsters during exposure to T30 (A-D) and T18 (E-H). Approximately 6 weeks of data under these conditions are double-plotted on a 24 h abscissa (B, D, F, H) or modulo-T (C, G). Curves at the bottom of panels C and G are educed waveforms of activity counts folded at modulo-T and averaged across all cycles depicted in actograms above. Lomb-Scargle periodogram analyses (A, E) were conducted on the first 19 days of the record prior to a short interval of missing data, indicated by a red line. Also shown (D, H) is 120 h of double-plotted activity modulo-24 h with shading representative of dark periods for assessment of light masking. Asterisks (in B, F) indicate starting points of 120 h blow-up plots (D, H). The actograms and periodograms illustrate the robust steady-state entrainment of hamsters in T30 versus the more variable entrainment in T18.
