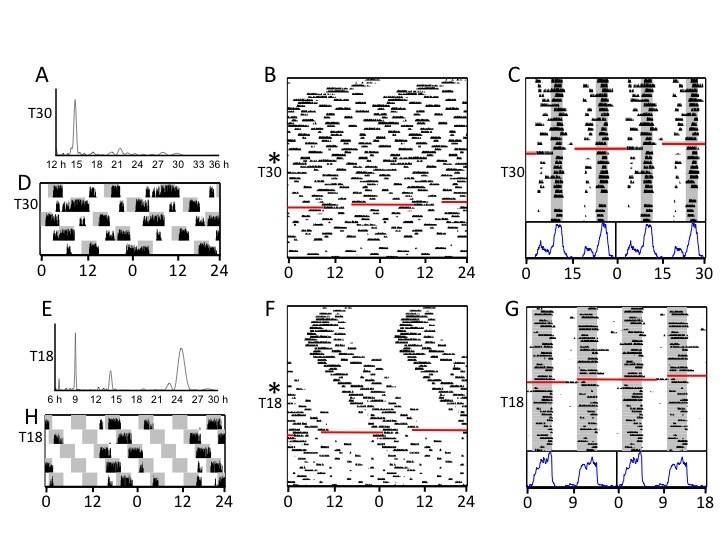
Figure 5.

Representative activity data from individual hamsters transferred abruptly from LD14:10 to long (A-D) and short (E-H) T cycles. Data double-plotted modulo-24 h (B, F) span the time from the initial transfer to T28.8 or T19.5 until they had been in T30 or T18 for 6 weeks. Data plotted modulo-T (C, G) include only intervals under final T cycles. Periodogram analyses (A, E) were conducted on the first 19 days of T30 or T18. The 120 h blow-up plots (D, H) correspond to beginning of the exposure to T30 and T18, respectively. The actograms illustrate the atypically entrained or free-running patterns of behavior resulting from abrupt transfer to extreme T cycles.
