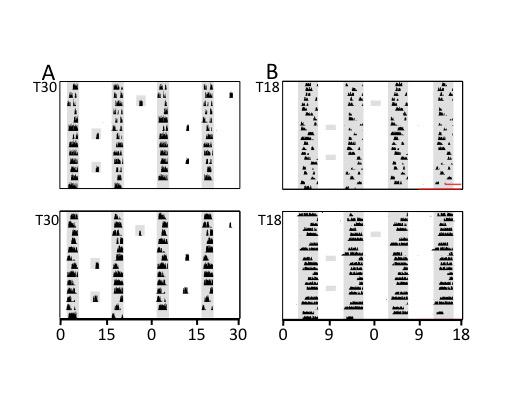
Figure 6.

Representative actograms of 2 hamsters in T30 (A) or T18 (B) including exposure to 3 h (T30) or 2 h (T18) dark probes (shaded areas) interpolated in the middle of scheduled light phases. Dark probes illustrate that light pulses are having actively suppressive effects on activity in T30 but not in T18.
