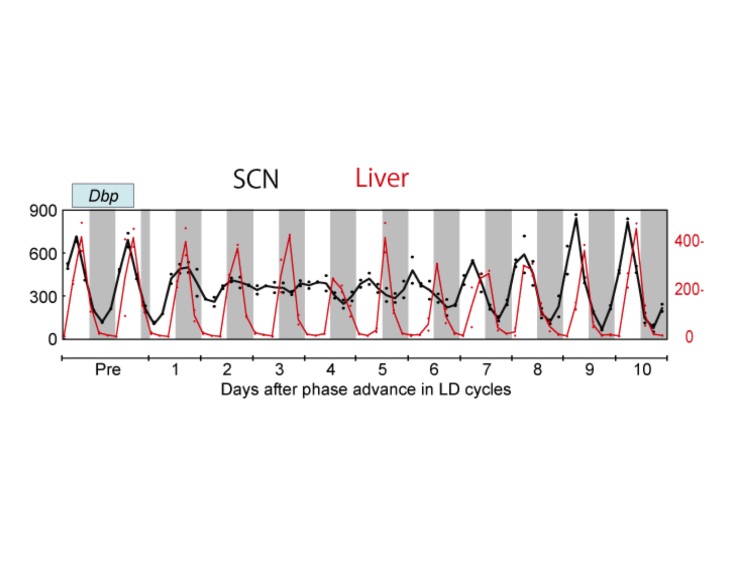
Figure 2.
Gene expression rhythms after an 8 h advance jetlag. Using qPCR, expression of clock genes was measured every 4 h after the phase shift in laser-microdissected tissue samples. Dbp gene expression rhythm in the SCN (black; left side Y-axis) and in the liver (red; right side Y-axis) with quantification of gene expression normalized to 36b4 expression, units of mmol/mol 36b4 mRNA. Adapted from Yamaguchi et al. (2013) [11]; Courtesy of Drs. Okamura and Yamaguchi.

