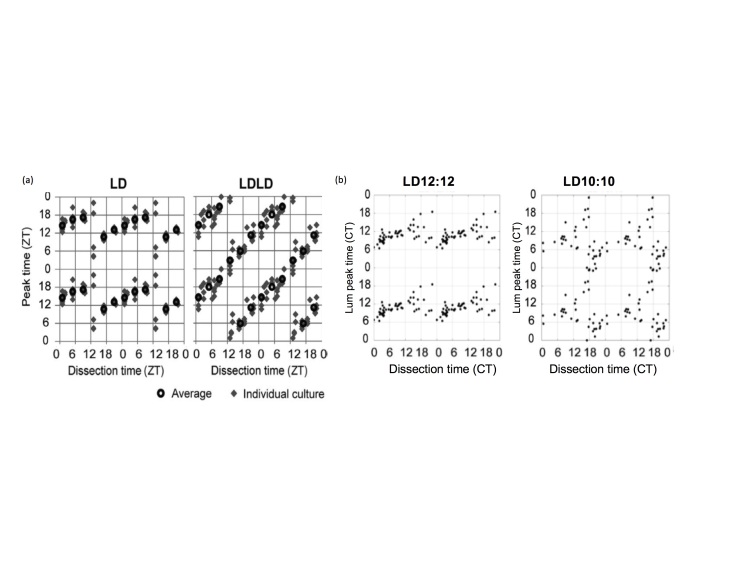
Figure 5.
(A) Relationship between peak time and dissection time of the SCN explants prepared from mice entrained to LD or LDLD bifurcated light periods, dissected at various time points across the day. Each gray diamond indicates a dissection time (ZT) and peak time of a single explant culture. Black circles indicate average peak times for each dissection time group. Data are quadruple plotted to aid visualization of the resetting pattern (from Noguchi et al., 2018). (B) Similar results found in our recent work using PER2::LUC mice, showing the effects of time of dissection on resetting of phase shifts. Each dot represents the time of dissection of the explanted SCN tissue and the peak time relative to Circadian Time (a timeframe based on the locomotor activity under constant dark conditions; CT) prior to dissection for that tissue. Adapted from Leise et al., 2018 [25].

