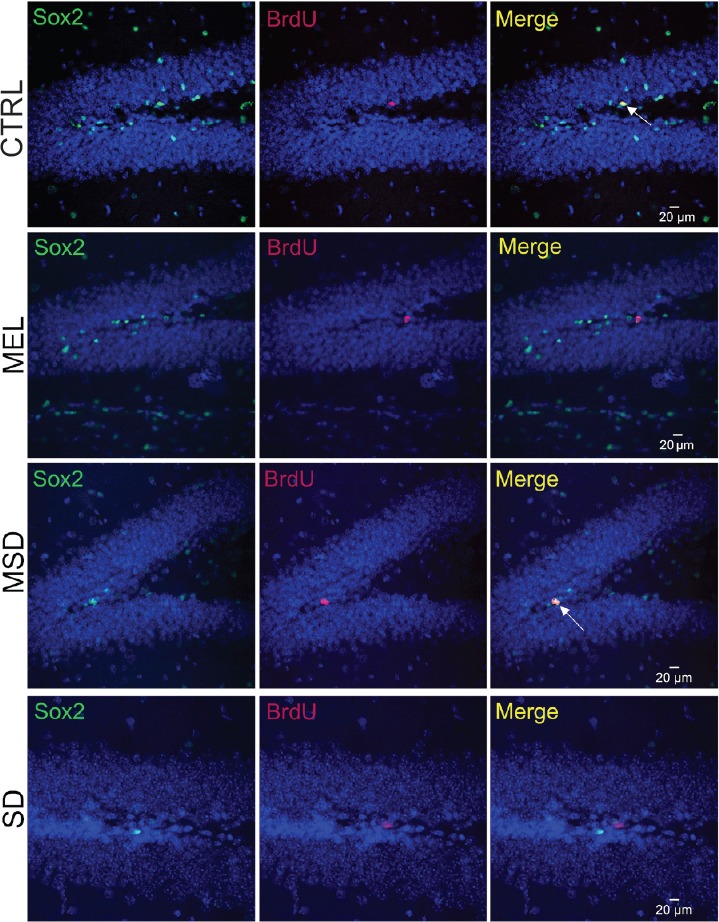
Figure 3.

Sox2+/BrdU+ cells in the subgranular zone of the dentate gyrus.
Sox2+ cells are in green (the left panels) and BrdU+ cells are in red (central panels). Right panels show the co-expression patterns for each group. White arrows indicate double-positive cells. Scale bars: 20 μm. n = 5 per group. CTRL: Control group; SD: sleep-deprived group; MEL: melatonin group; MSD: melatonin + sleep deprivation; BrdU: 5-bromo-2′-deoxyuridine.
