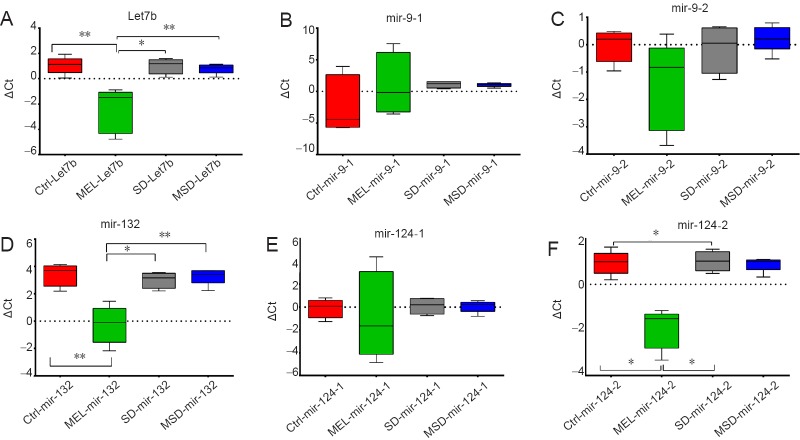
Figure 4.
MicroRNA expression in the hippocampus.
In this case, the lower value indicates the greater expression after normalization with respect to the reference gene, i.e., SnoRNA234 and RNAU6. (A) Let-7b expression. (B) Mir-9-1 expression. (C) Mir-9-2 expression. (D) Mir-132 expression. (E) Mir-124-1 expression. (F) Mir-124-2 expression. Bars show the mean ± SEM (n = 5 mice per group). *P < 0.05, **P < 0.01 (Mann-Whitney U test). ΔCt: Cycle threshold difference; CTRL: control group; SD: sleep-deprived group; MEL: melatonin group; MSD: melatonin + sleep deprivation.

