
Figure 2.
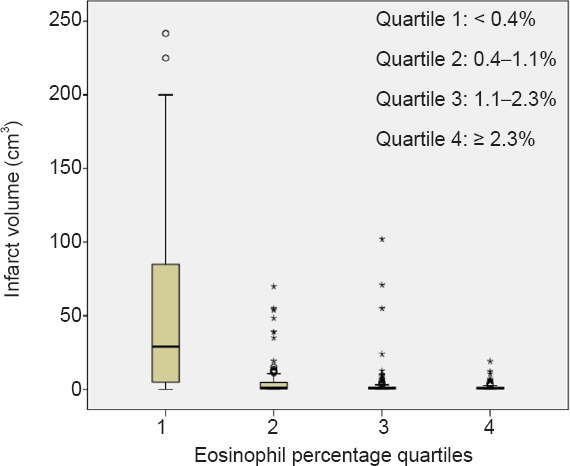
Infarct volume distribution in patients with AIS according to eosinophil percentage quartiles.
Box plot showing the median volumes (solid bar), minimum/maximum values (whiskers), and interquartile range (bar width) across eosinophil quartiles.