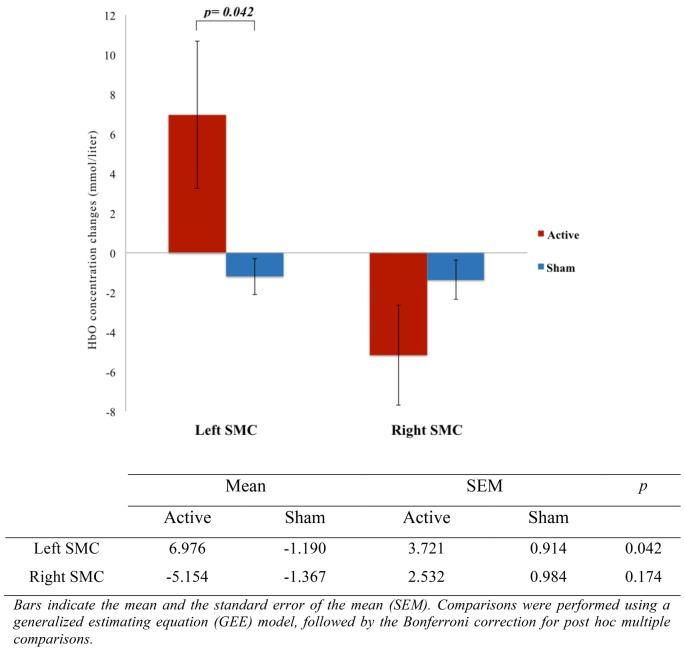
Figure 5.
Comparison of SMC activation between active and sham groups (n = 15). The figure shows a representation of the mean HbO concentration changes, measured in millimoles per liter (mmol/l) with correspondent p-value, indicating the difference of left SMC activation during accessory spinal nerve-peripheral electrical stimulation (ASN-PES).

