
Figure 8.
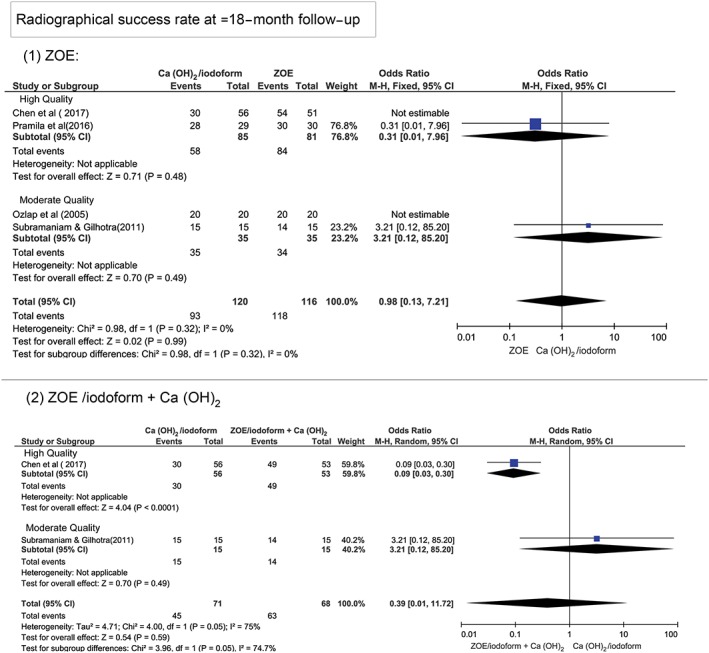
Forest plot for meta‐analysis of the radiographical success rates of Ca(OH)2/iodoform compared with ZOE and ZOE/iodoform combined with Ca(OH)2 at ≥18‐month follow‐up within studies of high and moderate quality
Official websites use .gov
A
.gov website belongs to an official
government organization in the United States.
Secure .gov websites use HTTPS
A lock (
) or https:// means you've safely
connected to the .gov website. Share sensitive
information only on official, secure websites.
Forest plot for meta‐analysis of the radiographical success rates of Ca(OH)2/iodoform compared with ZOE and ZOE/iodoform combined with Ca(OH)2 at ≥18‐month follow‐up within studies of high and moderate quality