. 2019 May 21;10(24):6072–6082. doi: 10.1039/c9sc01331h

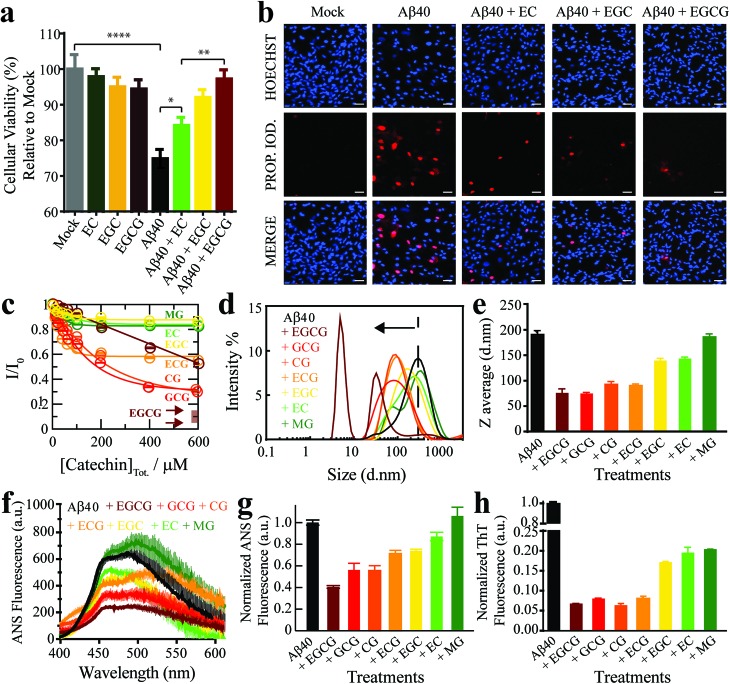
Fig. 1. The Aβn library samples a wide-distribution of toxicity, hydrophobic exposure, cross β-sheet content and sizes. (a) Mitochondrial activity of retinal pigment epithelial (RPE1) cells after treatment with representative Aβ40 assemblies and associated controls, as monitored by the reduction of resazurin using the PrestoBlue assay.33 The data reported show the mean and standard deviation of technical replicates. One-way ANOVA and subsequent Tukey's post-hoc test was used to determine statistical significance between treatments and mock (1X PBS delivery solution), with *, ** and **** representing p-values of 0.05, 0.01 and <0.0001, respectively. (b) Representative fluorescence microscopy images of RPE1 cells (scale bar, 50 μm), showing intracellular Hoechst 33342 and propidium iodide fluorescence after incubation with selected Aβ40 assemblies. (c) Normalized Aβ40 methyl intensity losses upon catechin addition relative to the state in the absence of catechins. (d) Size distribution of Aβ40 assemblies in the absence (black) and presence of catechins (coloured as per legend) as determined by intensity measurements in dynamic light scattering experiments. (e) Z-average of the Aβ40 assemblies in (d). (f) ANS fluorescence spectra of Aβ40 assemblies in the absence (black) and presence of catechins (colour coded as per the legend). (g) ANS fluorescence intensities at 454 nm for the samples in (k), normalized to the intensity for Aβ40 alone. (h) Thioflavin T fluorescence intensities at 485 nm of Aβ40 assemblies in the absence (black) and presence of catechins (coloured as per legend) normalized to the intensity of canonical assemblies.

Fig. 1