. 2019 May 21;10(24):6072–6082. doi: 10.1039/c9sc01331h

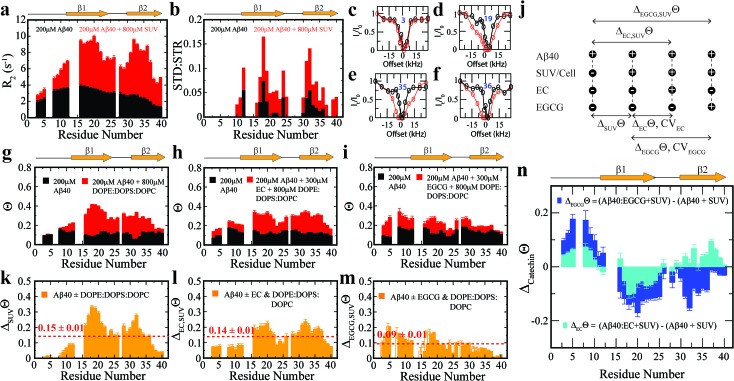
Fig. 3. Exchange dynamics of Aβ40 monomers on the surface of soluble Aβ40 assemblies and model membranes. (a) 15N-R2 and (b) MeSTDHSQC for the canonical Aβ40 assemblies in the absence (black) and presence (red) of DOPE : DOPS : DOPC SUVs. (c–f) Representative 15N-DEST profiles for the samples shown in (a). (g) 15N-Θ profiles for the samples shown in (a), colour coding is as per legend. (h) 15N-Θ profiles for canonical Aβ40 assemblies in the absence (black) and presence (red) of EC followed by DOPE : DOPS : DOPC SUV addition. (i) 15N-Θ profiles for canonical Aβ40 assemblies in the absence (black) and presence (red) of EGCG followed by DOPE : DOPS : DOPC SUV addition. (j) Definition of key differentials in the 15N-DEST measurements and the corresponding normalized cellular viabilities. (k) Difference between the Θ profiles shown in (g). The dashed red line indicates the average Θ value. (l) Difference in the Θ profiles shown in (h). (m) Difference between the Θ profiles shown in (i). (n) 15N-Θ difference profiles for (h, red) vs. (g, red) (cyan) and (i, red) vs. (g, red) (blue).

Fig. 3