
Figure 5.
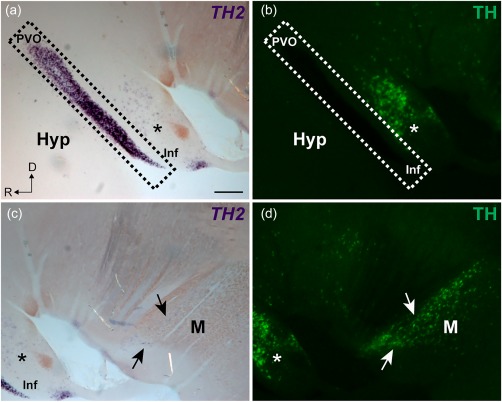
Double labeling for TH2 nonfluorescent in situ hybridization and TH immunofluorescence in chicken. A sagittal section of chicken brain showing TH2 transcripts (purple) and TH immunoreactivity (green) in the hypothalamic (a, b) and mesencephalic (c, d) areas. TH2 transcripts are abundant in the PVO (a; dashed area) and scarce in a cell population corresponding to A11 (a; asterisk). In contrast, TH immunoreactive cells are abundant in the A11 cell group (b; asterisk), while they are absent in the PVO (b; dashed area). The mesencephalic TH immunoreactive cells also express TH2 (c; arrows), but compared to the TH immunoreactivity (d; arrows), the TH2 + signal is very low. D = dorsal; Hyp = hypothalamus; Inf = infundibulum; M = mesencephalon; R = rostral. Scale bar = 200 µm in (a) (applies to a, b, c, d)