
Figure 6.
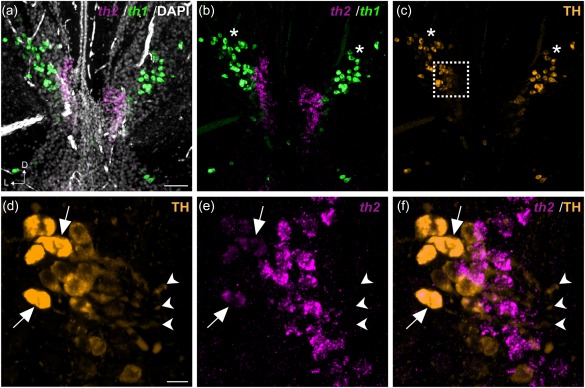
Localization of th1, th2, and TH immunoreactivity in the PVO of Xenopus. Confocal images obtained from a frontal section of the Xenopus PVO are shown (Z projections = 10 µm). Counterstaining with DAPI (gray) shows that th2 (magenta) is expressed in the region corresponding to PVO (a). A cell population displaying strong th1 signal (green) is found dorsolaterally to the PVO (asterisks in b), which overlaps with TH immunoreactivity (orange; asterisks in c). Higher magnification of the area delimited by a dashed square in (c) is shown in (d–f). Faint TH immunoreactivity is also found in CSF‐c cells in the Xenopus PVO. TH+ labeling is observed in the soma and in the processes bathing the ventricle of CSF‐contacting cells (arrowheads in d–f). A few CSF‐contacting cells expressing th2 are also TH immunoreactive (arrows in d–f). D = dorsal; L = lateral. Scale bar = 50 µm in (a) (applies to a, b, c); 100 µm in (d) (applies to d, e, f)