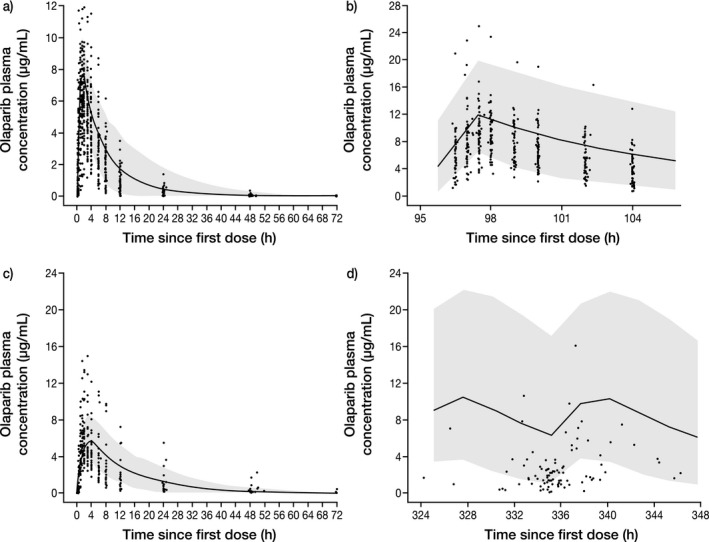
Figure 1.

Simulated plasma concentration–time profile for (a) single‐dose olaparib tablet (300 mg), (b) multiple‐dose olaparib tablet (300 mg b.i.d.), (c) single‐dose olaparib capsule (400 mg), and (d) multiple‐dose olaparib capsule (400 mg b.i.d.), compared with observed olaparib clinical data. The continuous line represents the median prediction using the PBPK model; the shaded area represents the 95% prediction intervals. Closed circles are observed data points from olaparib clinical trials NCT01921140 (a,b) and NCT01851265 (c), as well as pooled clinical trial data from NCT00572364, NCT00516373, NCT00494234, NCT00494442, NCT00628251, and NCT00777582 (d).
