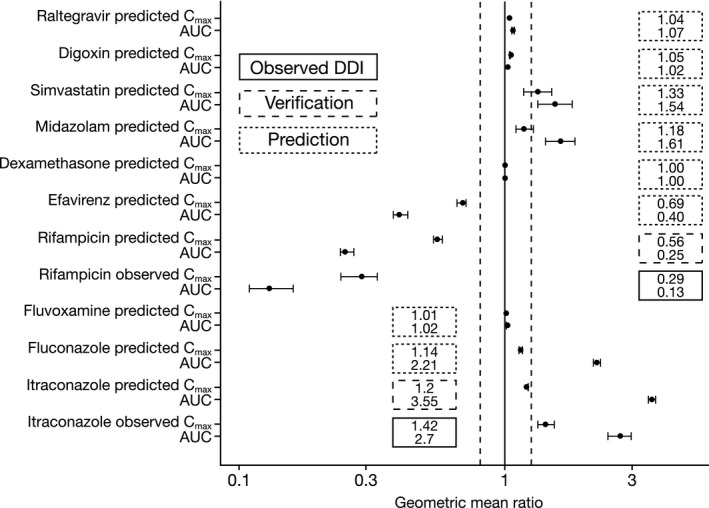
Figure 2.

DDI predictions using the olaparib tablet model (AUC and Cmax ratios with 95% CI*) and observed olaparib tablet clinical data for interactions with itraconazole and rifampicin. *90% CIs are shown for observed clinical data for olaparib tablet monotherapy in clinical trials “21, 22” following single or multiple oral tablet doses, respectively.22 CI, confidence interval. Vertical dotted lines represent the (80% and 125%) interval.
