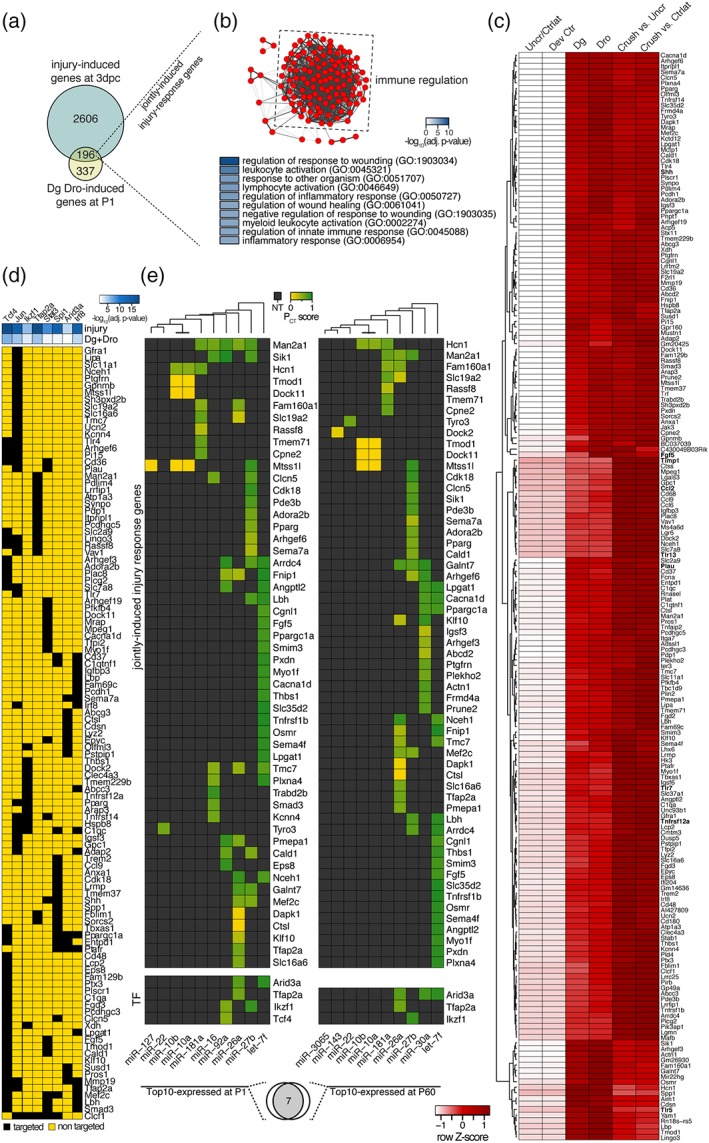
Figure 4.

Microprocessor‐dependent injury‐response genes are predicted targets of abundant miRNAs and differentially expressed transcription factors. (a) Venn diagram of injury‐induced genes (3 dpc) and genes induced in Dgcr8 and Drosha cKO. 196 genes are induced in both conditions (termed jointly induced injury‐response genes). (b) Network graph produced by Cytoscape 3 showing significantly enriched GO biological process gene sets among the common injury‐response genes imported into Enrichment Map (top panel). Nodes represent individual GO term gene sets. Edges represent the relatedness between the genes within the gene sets. Genes are highly enriched for immune regulatory and injury‐related functions. Top 10 significantly enriched GO terms are shown in the panel below. (c) Heatmap of jointly expressed injury‐response genes. Color intensities represent row Z‐score, red indicating higher expression and white indicating lower expression. (d) Upregulated transcription factors (TFs) with predicted binding motifs in the promoter regions of jointly differentially expressed injury‐response genes (i.e., both upregulated and downregulated) in 3 dpc SNs compared to contralateral and uncrushed controls and in SNs of Dg and Dro at P1 compared to controls (fold change ≥2, FDR ≤ .05). Negative decadic logarithm of adjusted p value of TF target enrichment among injury induced genes (injury) and genes induced in Dgcr8 and Drosha cKO (Dg + Dro) is color‐coded (white indicating high and blue low p values). Targeted (black) and nontargeted (yellow) jointly differentially expressed injury‐response genes are shown for each TF. (e) Top 10 expressed miRNAs in P1 and P60 SNs of wild‐type mice and their predicted target sites (based on TargetScan) among the jointly induced injury‐response genes and upregulated TFs predicted to target jointly differentially‐expressed injury‐response genes. Target site conservation and quality is represented by the PCT score and nonpredicted targets (NT) in grey. Venn diagram below indicating 7 out 10 most abundant miRNAs overlap between P1 and P60 [Color figure can be viewed at wileyonlinelibrary.com]
