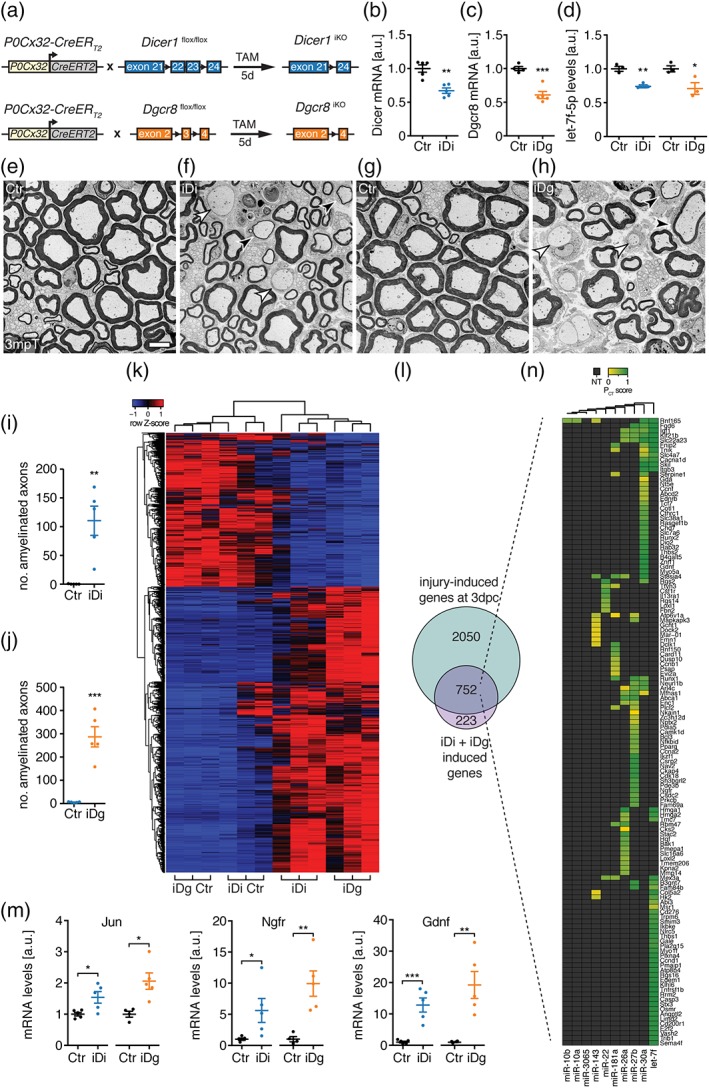
Figure 5.

Dgcr8 and Dicer are required to properly maintain the myelinating SC fate. (a) Scheme of tamoxifen‐induced SC‐specific Dicer and Dgcr8 deletion strategy. (b,c) Levels of Dicer mRNA (b) in SNs of induced P0‐Cx32 CreERT2 ‐Dicer1 flox/flox (iDi) and Dgcr8 mRNA (c) in induced P0‐Cx32 CreERT2 ‐Dgcr8 flox/flox mice (iDg) compared to respective controls (Ctr) in 3 months post‐tamoxifen (mpT) SNs. Number (n) of mice per condition: Ctr (n = 4 and 5), iDi (n = 5), and iDg (n = 5). (d) Levels of let‐7f‐5p normalized to sno‐202 in 3 mpT SN of iDi and iDg compared to respective controls (Ctr) (n = 3 mice per condition). (e–h) Electron micrographs of iDi (f), iDg (h), and their respective controls (e,g). Examples of amyelinated (white arrowheads) and thinly myelinated axons (black arrowheads) are highlighted. (i,j) Number of amyelinated axons per SN cross‐section in iDi (i) and iDg (j) compared to their respective controls at 3 mpT (n = 5 mice per condition). (k) Heatmap of differentially expressed genes in iDi and iDg (fold change ≥2, FDR ≤ 0.05) compared to their respective controls (iDg Ctr and iDi Ctr) at 3 mpT. Color intensities represent row Z‐score, red indicating higher expression and blue indicating lower expression. (l) Venn diagram showing upregulated genes in 3 dpc SNs and in iDi and iDg (fold change ≥2, FDR ≤ 0.05). (m) Levels of Jun, Ngfr, and Gdnf mRNA in SNs of iDi and iDg compared to their respective controls at 3 mpT. Number (n) of mice per condition: Ctr (n = 4 and 5), iDi (n = 5), and iDg (n = 5). (n) Top10 miRNAs expressed at P60 and their predicted target sites (target scan) among the 752 genes induced in 3 dpc SNs and in iDg and iDi. Target site conservation and quality is represented by the PCT score and nonpredicted targets (NT) in gray. Scale bar, 5 μm (e–h). All mutant animals used were preselected based on morphology (b–k,m). Error bars: SEM. Two‐sided two‐sample Student's t test *p < .05, **p < .01, ***p < .001 (b–d,i,j,m) [Color figure can be viewed at wileyonlinelibrary.com]
