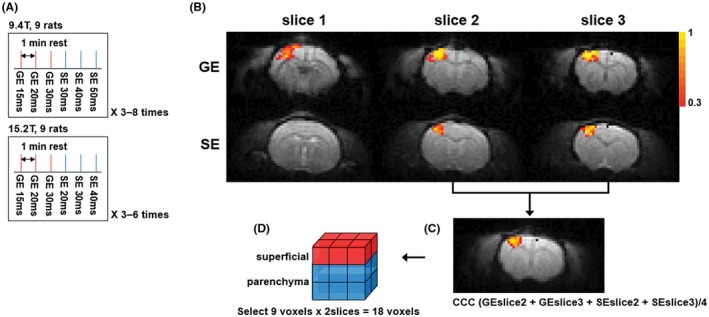
Figure 1.

(A) Experimental protocol of 9.4 T and 15.2 T. Three TE GE‐BOLD runs and 3 TE SE‐BOLD runs were performed sequentially. The protocol was repeated 3 to 8 times. Each BOLD run was separated by a rest of 1 minute. (B) Statistical maps with GE‐ (TE = 20 msec) and SE‐BOLD (TE = 40 msec) overlaid on corresponding BOLD images at 9.4 T. Color bar represents the cross‐correlation values. (C) Averaged CCC map from 2 selected slices of GE‐ and SE‐BOLD overlaid on averaged BOLD images. (D) Selected 9 voxels by 2 slices. The superficial ROI was selected as a region with 3 superficial voxels by 2 slices (red), and the parenchyma ROI was selected as a region with 6 inner voxels by 2 slices (blue)
