Figure 2.

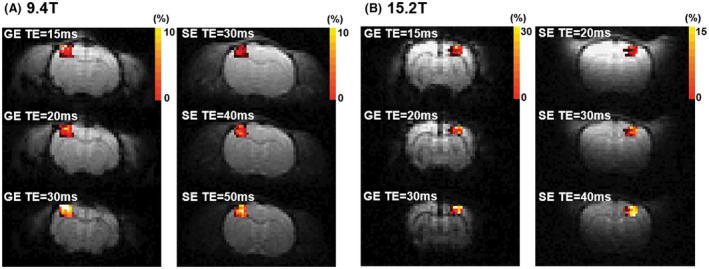
Statistical activation maps from 3 TE GE‐ and SE‐BOLD overlaid on the corresponding EPI images at 9.4 T (A) and 15.2 T (B). Color bar represents percent changes

Statistical activation maps from 3 TE GE‐ and SE‐BOLD overlaid on the corresponding EPI images at 9.4 T (A) and 15.2 T (B). Color bar represents percent changes