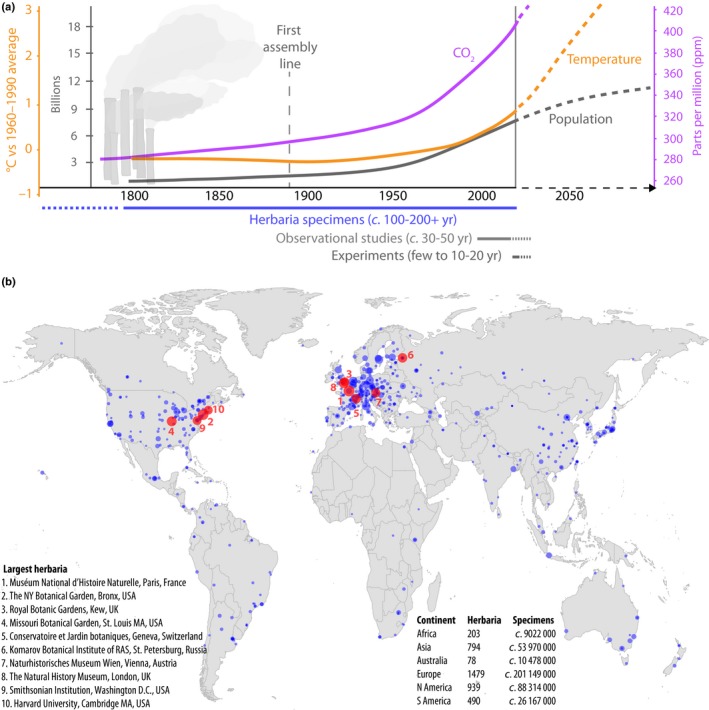
Figure 1.

Herbaria as global change witnesses. (a) Timeline of global change, with lines tracking changes in world population, air temperature and atmospheric CO 2 during the last c. 200 years. Dashed line ends indicate future projections. Bars below plot indicate the typical temporal extent of herbarium samples vs observational studies and experiments. (Population growth: United Nations, Department of Economic and Social Affairs, Population Division (2017); World Population Prospects: The 2017 Revision. http://esa.un.org/unpd/wpp/; temperature: representative concentration pathway 8.5, Intergovernmental Panel on Climate Change, www.ipcc.ch; (Marcott et al., 2013); CO 2: (Neftel et al., 1994)). (b) Map with global distribution of herbaria (for visual clarity displaying only herbaria of > 100 000 specimens), names of the largest 10 herbaria, and number of herbaria and herbarium specimens curated per continent (reflecting places of storage of specimens, not their origins; Herbarium data from Index Herbariorum, http://sweetgum.nybg.org/science/api/v1/institutions/. Accessed in April 2018).
