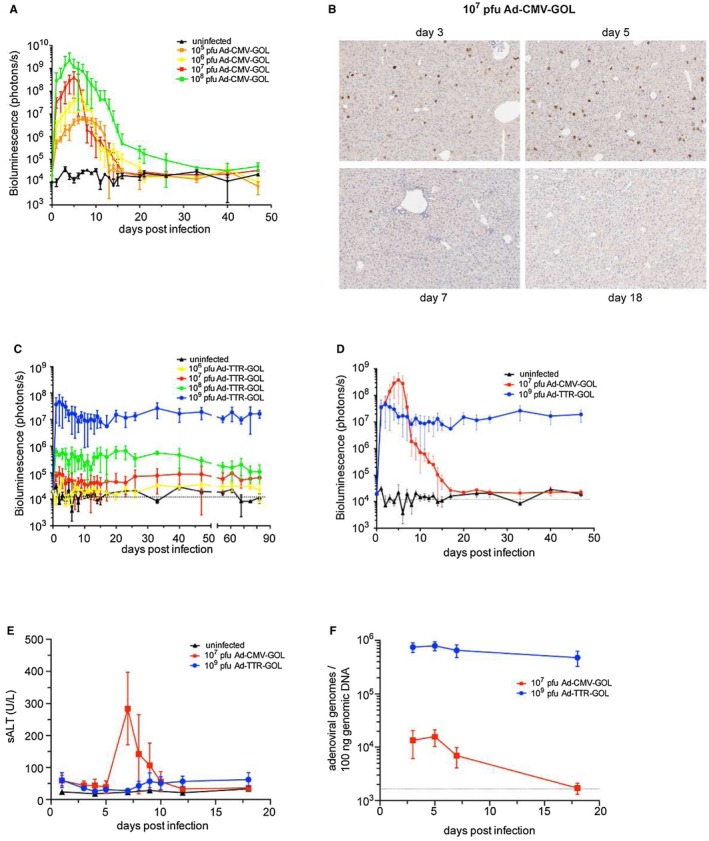
Figure 2.

Viral persistence after infection with Ad‐TTR‐GOL. (A) Quantification of bioluminescence in mice after infection with increasing doses of Ad‐CMV‐GOL (105 to 108 PFU). (B) Liver immunohistochemistry for EGFP expression at indicated time points after infection with Ad‐CMV‐GOL (107 PFU). (C) Quantification of bioluminescence in mice after infection with increasing doses of Ad‐TTR‐GOL (106 to 109 PFU). (D) Overlay of results from bioluminescence imaging of Ad‐CMV‐GOL (107 PFU) or Ad‐TTR‐GOL (109 PFU) infected mice. (E) Time kinetics of serum ALT levels of mice after infection with Ad‐CMV‐GOL (107 PFU) or Ad‐TTR‐GOL (109 PFU). (F) Time kinetics of adenoviral genome copies by quantitative real‐time PCR in livers after infection with Ad‐CMV‐GOL (107 PFU) or Ad‐TTR‐GOL (109 PFU). (A,C‐F) Data show mean ± SD of five mice per group. All experiments have been performed at least three times and were reproducible.
