
Figure 4.
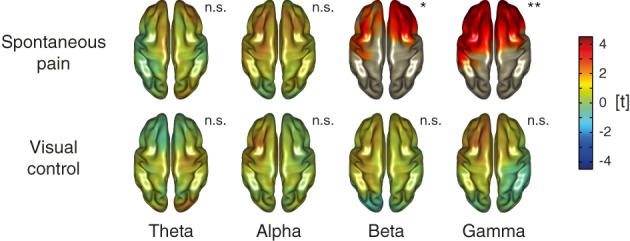
Relationships between ongoing pain intensity and neuronal oscillations on source level. Source‐level t maps of the relationship between ratings during the spontaneous pain and visual control condition and brain activity as assessed by linear regressions for theta (4–7 Hz), alpha (8–13 Hz), beta (14–29 Hz), and gamma (60–90 Hz) frequencies. As in the previous figure, scaling reflects t values resulting from nonparametric cluster‐based permutation tests and positive and negative relationships are reflected by warm and cold colors, respectively. In plots showing significant relationships, areas outside of significant clusters are masked. in plots without significant effects, opacity is reduced. n.s., not significant; *p < .05 (two‐sided), **p < .01 (two‐sided). [Color figure can be viewed at http://wileyonlinelibrary.com]