
Figure 2.
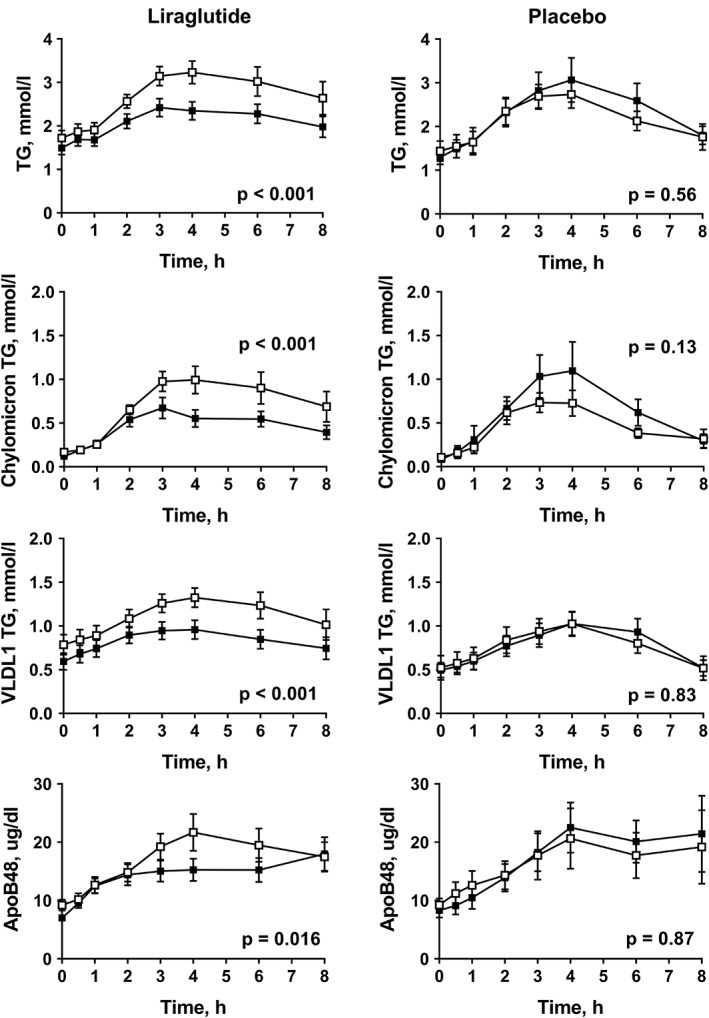
Responses of plasma triglycerides (TG), chylomicron TG, VLDL1 TG and plasma apoB48 after a fat‐rich mixed meal before treatment (open squares) and at week 16 (filled squares) in subjects with type 2 diabetes treated with liraglutide (n = 15) or placebo (n = 7). P values were calculated using the ANOVA repeated measures test for within‐group differences